S&P 500, Nasdaq 100 Soar as Traders Weigh Economic Resilience vs. Geopolitical Risks

US STOCKS OUTLOOK:
- S&P 500 jumps 1.43% and reclaims its 200-day simple moving average
- Nasdaq 100 soars 2.2% at the market close, reaching its highest level since February 11th.
- In this article we explore key technical levels for the S&P 500 and Nasdaq 100
Most read: DAX 40 and CAC 40 Technical Forecast for the Days Ahead
S&P 500 Traders: Wall Street equity indices soared on Thursday,erasing losses from the previous session as
traders shrugged off the new sanctions imposed on Russia by the West, shook off Fed jitters, and welcomed
various encouraging U.S. economic reports.
At the market close, the S&P 500 rose 1.43% to 4,520,reclaiming its 200-day simple moving average thanks to a solid rally driven by strong gains in semiconductor and materials stocks. The Dow Jones, for its part, climbed 1.02% to 34,707, but failed to push above channel resistance in the 34,850 area. Lastly, the Nasdaq 100 outperformed its peers and surged 2.2% to 14,765, its best level since February 11, as a sell-off in oil prices eased inflation anxiety.
Earlier in the day, U.S. employment figures showed that jobless claims for the week ending March 19 fell by 28,000 to 187,000 applications, the lowest level since September 1969. The report, which tends to be a proxy for layoffs, suggests the labor market remains strong as companies desperately try to hold onto workers amid near-record job openings.
S&P 500 Traders
The good news didn’t end there in terms of positive data. In another report, S&P Global noted that growth accelerated sharply this month, with the manufacturing PMI hitting a six-month high of 58.5 and the services activity index advancing to 58.9, the fastest pace since June of last year. Recently, the flattening yield curve has heightened recession fears, but solid expansion in these two sectors of the economy is certainly helping to calm some of those concerns.
Looking ahead, the economic calendar features some medium-impact events on Friday, including the Michigan consumer sentiment survey and some Fedspeak, but next week’s deck brings more important releases, withMarch Non-Farm Payroll (NFP) being the highlight. As the outlook remains subject to extraordinary uncertainty between monetary policy risks and geopolitical shocks, traders should keep an eye on incoming data to assess how the economy is evolving and responding to current headwinds.
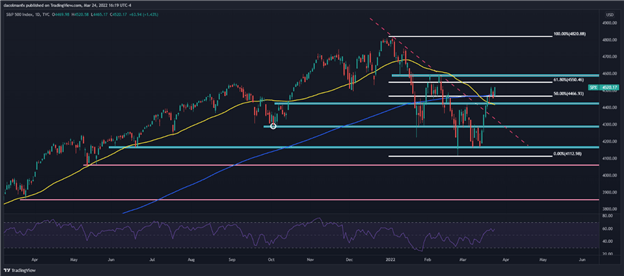
S&P 500 TECHNICAL ANALYSIS
After Wednesday’s pullback, dip buyers reappeared, pushing the S&P 500 decisively above its 200-day simple moving average and the 50% Fibonacci retracement of the 2022 decline. With the VIX falling rapidly and approaching the 20-handle, there will be more appetite to take on more risk, a situation that may allow equity market bulls to remain on the offensive. On that note, the S&P 500 could pick more momentum in the coming sessions, gearing up for a challenge of the 61.8% Fib level near 4,550, followed by 4,585. Alternatively, if the bullish impetus fades and sellers return, the 200-day SMA should act as a decent support in case of weakness, although a break below this floor could trigger a sizeable sell-off, exposing 4,420, and 4,285 thereafter.
S&P 500 TECHNICAL CHART
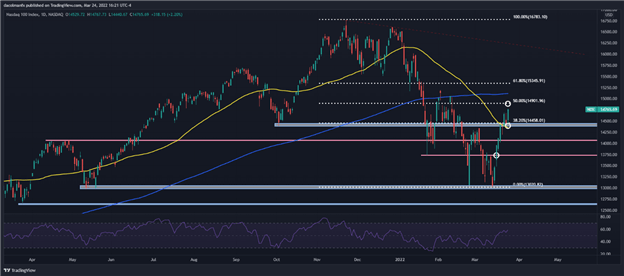
NASDAQ 100 TECHNICAL ANALYSIS
The Nasdaq 100 rallied aggressively Thursday, reaching a new monthly high above 14,700. With bulls firmly entrenched in the driver’s seat, we could see additional gains in the days ahead and a possible move towards 14,901, the 50% Fibonacci retracement of the November 2021/March 2022 sell-off. If the tech benchmark manages to venture atop this resistance, the 200-day simple average will become the next upside focus. On the other hand, if prices pivot lower, technical supports rests at 14,458/14,360, but if this area fails to hold, there is scope for a pullback towards 14,050.
NASDAQ 100 TECHNICAL CHART