S&P 500, Dow Jones Forecast: Bulls Jump Ship and Threaten the Nascent Rebound
U.S. STOCKS OUTLOOK:
- S&P 500, Nasdaq 100 and Dow Jones all trade lower on Wednesday
- No major catalysts during the trading session, but bulls appear to be taking profits following the recent run higher in the market
- In this article we explore key technical levels for the S&P 500 and Dow Jones
Most read: S&P 500, Nasdaq 100, Dow Forecasts – Rate Hike Rally Begins Pullback
S&P 500 Dow Jones: After Tuesday’s strong gains, U.S. stocks came under some selling pressure on Wednesday, in a session characterized by moderate volatility and no significant catalysts other than the sharp rise in crude oil, a development that may further exacerbate inflationary forces in the economy, ceteris paribus.
At the market close, the S&P 500 dropped1.23% to 4,456, retreating from the two-week high set yesterday as bulls bailed to take profits following the explosive run higher in the equity space witnessed since last week. For its part, the Dow Jones declined 1.29% to 34,358, dragged down by heavy losses in shares of Home Depot (HP), Boeing (BA) and Salesforce (CRM). The Nasdaq 100, meanwhile, tumbled1.41% to 14,447, but weakness was likely contained by the small pullback in Treasury rates.
Looking ahead, the economic calendar has high-impact events tomorrow, including February Durable Goods Orders and the March Markit Manufacturing PMI (Flash). It is important to keep an eye on both reports to assess the strength of the U.S. economy and the outlook for corporate earnings in light of growing uncertainty about the recovery and headwinds coming from all directions.
S&P 500
Outside of macroeconomic data, the retail crowd should continue to monitorgeopolitics and recent developments in the bond market, specifically surging government rates and theflattening of the yield curve amid four-decade high CPI readings.
On the geopolitical front, there is no end in sight to the war between Russia and Ukraine, which has been dragging on for almost a month. The longer the military conflict lasts, the greater the negative impact on confidence, the global economy and inflation, especially if trade flows are further disrupted. In this regard, it is worth noting that the United States and its European allies are expected to impose new sanctions on Moscow on Thursday. Traders should follow the news closely to see what new measures are rolled out and how they may affect commodities (energy, grains, metals, etc.).
As for Treasuries, yields have risen aggressively in March due to the repricing of monetary policy and expectations that the Fed will soon begin front-loading hikes in 50 basis point increments to restore price stability and, of course, credibility. These wagers have accelerated the flattening of the curve to the point that the 2s10s spread is within 20 basis points of inverting – an event thatoften foreshadows an economic downturn.
In any case, although sentiment has improved on balance, as reflected in the stock market’s performance, current developments in terms of geopolitics and rates are not supportive of valuations or conducive to risk-taking. All this suggests that the bullish momentum seen since last week may not be sustained for long and that the recent rally is on shaky footing. That said, caution is warranted.
S&P 500 TECHNICAL ANALYSIS
The S&P 500 posted moderate losses on Wednesday likely on profit taking following the forceful rally that began last week. Generally, after seeing large gains, stocks will tend pause and struggle for direction amid tug of war between buyers and sellers, so I wouldn’t rule out some congestion before a new breakout. As far as key levels, the index is moving back and forth around its 200-day moving average. If we see a weekly close below this trend indicator, bulls could start bailing, paving the way for a move towards 4,420, followed by 4,285. On the other hand, if the equity benchmark manages to consolidate above the 200-day SMA, bullish impetus could pick up pace, creating the right conditions for an upswing towards 4,550, the 61.8% Fibonacci retracement of the 2022 decline. On further strength, the S&P 500 could challenge the next resistance at 4,585.
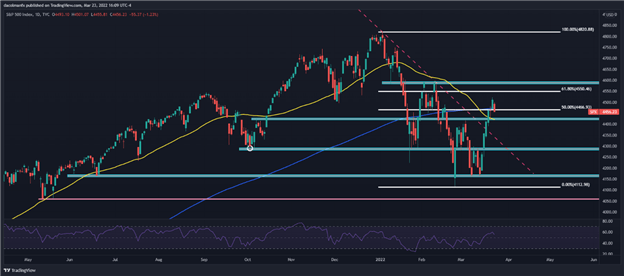
S&P 500 (SPX)
DOW JONES TECHNICAL ANALYSIS
S&P 500 Dow Jones: The Dow Jones also staged a robust rally in recent days, but has been unable to clear cluster resistance spanning from 34,635 to 34,975. While the blue-chip index was rejected lower from those levels, it doesn’t necessarily mean sellers are back in control, but for better guidance, we’d need to see how prices behave in the coming days. That said, if bulls resurface and propel the index above 34,635/34,975, we could see an attack on 35,192, the 61.8% Fibonacci retracement of the 2022 correction.
On the other hand, if losses begin to pile up, initial support rests at 34,080/34,000. If this floor is breached on the downside, selling pressure could accelerate rapidly, setting the stage for a retest of the January low near 33,150.
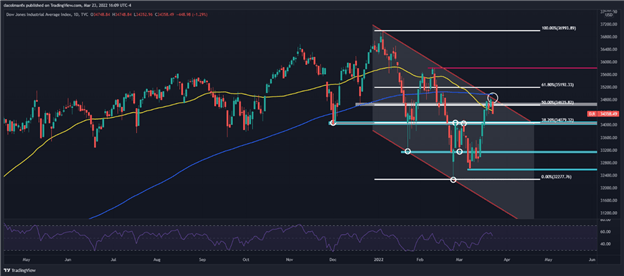
Dow Jones (DJI)
EDUCATION TOOLS FOR TRADERS
- Are you just getting started? Download the beginners’ guide for FX traders
- Would you like to know more about your trading personality? Take the WAVESSCOUT FX and find out
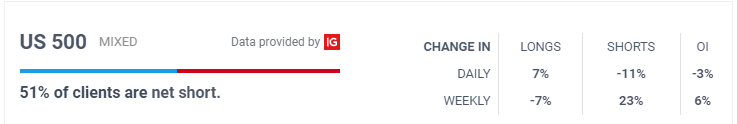
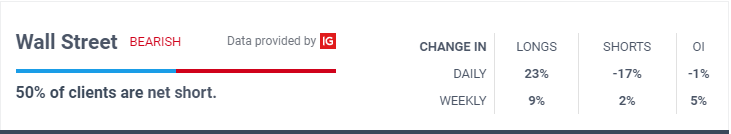
- IG’s client positioning data provides valuable information on market sentiment. Get your free guide on how to use this powerful trading indicator here.