Gold Price Forecast: RSI Sell Signal Emerges Ahead of US NFP Report
Gold Price Forecast: RSI Sell, The price of gold struggles to extend the series of higher highs and lows from earlier this week as Federal Reserve Chairman Jerome Powell prepares US lawmakers for a material shift in monetary policy; and recent developments in the Relative Strength Index (RSI) indicate a larger; pullback for bullion as the oscillator falls back from overbought territory to indicate a textbook sell signal. Advertisement
GOLD PRICE FORECAST: RSI SELL SIGNAL EMERGES AHEAD OF US NFP REPORT
The price of gold appears to be reversing ahead of the February high ($1974) as Chairman Powell insists that “it will be appropriate to raise the target range for the federal funds rate at our meeting later this month,” and the upcoming shift in Fed policy may drag on bullion as market participants brace for higher US interest rates.
The comments suggest the Federal Open Market Committee; (FOMC) will layout a more detailed exit strategy as Chairman Powell pledges to “proceed in a predictable manner” when normalizing monetary policy; and it remains to be seen if the Fed officials will project a steeper path for the Federal Funds rate as the central bank is slated to release the updated Summary of Economic Projections (SEP) at the next interest rate decision on March 16.
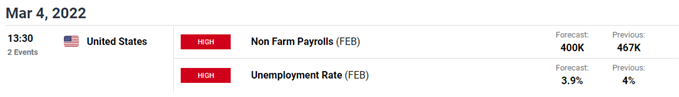
Until then, developments coming out of the US along with swings in investor confidence may influence the price of gold as the Non-Farm Payrolls (NFP) report is anticipated to show a further improvement; in the labor market, with the economy expected to add 400K jobs in February.
Another uptick in US employment may generate a bearish reaction in the price of gold as it puts pressure on the FOMC to adjust its exit strategy; and the precious metal may face a larger correction over the coming days as it struggles to extend the series of higher highs and lows from earlier this week.
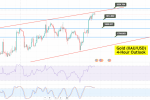
With that said, the near-term rally in the price of gold points to a potential shift; in the broader trend as it clears the 2021 high ($1959); but recent developments in the; Relative Strength Index (RSI) indicate a larger pullback for bullion as the oscillator falls back from overbought territory to indicate a textbook sell signal.
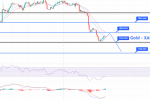
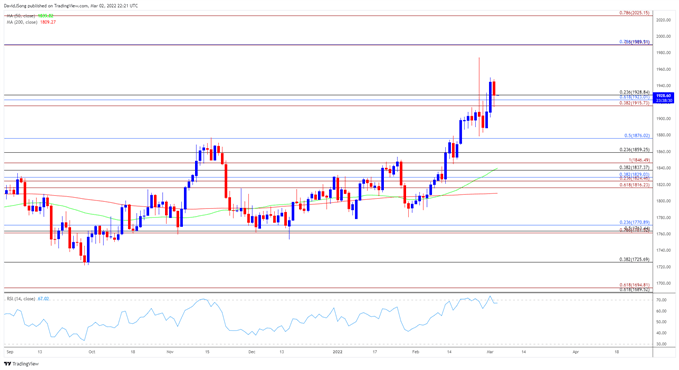
GOLD PRICE DAILY CHART
Source: Trading View
- The broader outlook for the price of gold has become bullish as it cleared the opening range; for 2022 in February, with bullion taking out the 2021 high ($1959) as the Relative Strength Index (RSI) climbed above 70 for the first time this year.
- However, the price of gold appears to be reversing ahead of the February high ($1974) as it struggles to extend the series of higher highs and lows from earlier this week; with the RSI highlighting a similar dynamic as the oscillator falls below 70 to indicate a textbook sell signal.
- Lack of momentum to hold above the Fibonacci overlap; around $1916 (38.2% expansion) to $1929 (23.6% retracement) may push the price of gold back towards the $1876 (50% retracement) region; with a break/close below the $1859 (23.6% retracement) area opening up the $1837 (38.2% retracement) to $1847 (100% expansion) zone.