US Crude Oil Above $80 Since 2014, USD/CAD Plunges Below Support
US Crude, Crude Oil has been on a strong bullish trend since the coronavirus shock sent US WTI oil to -$37.50 in April 2020. Since the decline ended, following the massive doji candlestick at the bottom; it has been a one-way direction for crude Oil. The pullbacks have been very minimal and today it broke above the big round level at $80, for the first time since November 2014.The monthly chart of crude is shown below and I think it clearly illustrates how much room there is to run on this breakout, which came after four months of consolidation. The break also came right after the latest OPEC+ meeting, which offers some fundamental support along with gas-to-oil switching; which is in full swing right now. In fact; we might even see some coal-to-oil switching with inventories in India and elsewhere at unbelievably low levels.
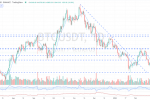
US WTI Crude Oil Monthly Chart

US crude Oil has pushed above all moving averages
If we get to $100 — and I think it’s more of a matter of ‘when’ than ‘if’ — there are some big knock-ons in terms of industrial/consumer costs and inflation. There’s also a political toll and that’s why I think the White House has blinked on Iran sanctions.
OPEC has spare capacity so the chance of a swift move to $100 or above is low but can’t be ruled out. At the end of the day; OPEC wants higher prices and if holding back some supply gets them there while making a few enemies then so be it.
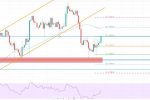
US WTI Crude Oil Live Chart
Everything I’ve read on oil companies suggests that capital spending isn’t coming back to pre-pandemic levels. Share has discipline now and banks aren’t lending to small drillers. Pipelines are hell to get built and share prices are still extremely depressed so all the excess capital is being funneled to buybacks and debt payments. This has been the perfect storm for a while and it’s finally coming to pass.
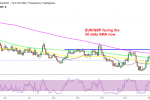
USD/CAD Monthly Chart Analysis – Is the Downtrend Resuming?

Forming a reversing pattern below the 50 monthly SMA
USD/CAD was on a bearish trend since April last year as crude Oil kept increasing. It continued to decline until summer this year; when it reversed higher at 1.20; which seems like it was the target for sellers. But, this might have been a mere retrace, before the decline resumes again. The price has formed a doji candlestick below the 50 SMA which is a bearish reversing signal; and this month we are seeing a bearish reversal down.