S&P 500, Dow Jones Technical Outlook: Bullish Momentum Fades
S&P 500, DOW JONES TECHNICAL ANALYSIS
- S&P 500: potential descending wedge breakout assessed
- Dow Jones Industrial Average (DJIA): Key zone propping up the index
FED ACHIEVES LIFT-OFF: 25 BASIS POINT HIKE CONFIRMED
S&P 500 Outlook: Yesterday the FOMC confirmed the much talked about 25 basis point hike along with the Fed’s
Summary of Economic Projections (SEP) which saw the rate forecast for 2022 rise from 0.90 percent
to 1.90 percent.
The current projections imply a hike at every Fed meeting this year which would see the Fed hike 7
times should they continue to hike in 25 bps increments. Furthermore, Chairman Powell and the
statement made clear that quantitative tightening (reducing the balance sheet) would start soon – as
soon as the next meeting on May 4th.
S&P 500 KEY TECHNICAL LEVELS
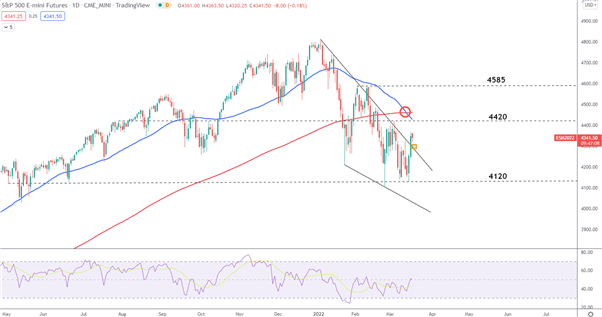
The S&P 500 index broke out of the descending wedge formation, which is typically a bullish pattern. Yesterday price action broke above the upper trendline of the wedge pattern and appears to be heading back towards the trendline, now as support.
A continued pullback may find support around the descending trendline before attempting a confirmed breakout from the wedge with continued momentum. 4420 and 4584 are the nearest relevant levels of resistance.
The 50 and 200 day simple moving averages have recently crossed, creating a ‘death cross’ – a bearish indication. Therefore, the possibility of another false breakout remains in play. Should we erase the last 48 hours of gains, the next level of support appears at 4120 followed by 4100.
S&P 500 Daily Chart
S&P 500 Technical Outlook
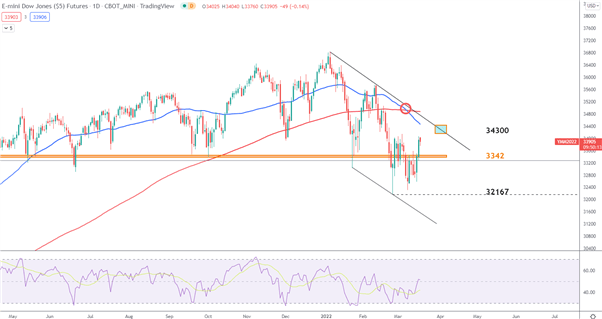
DOW JONES KEY TECHNICAL LEVELS
S&P 500 Outlook: The technical landscape is somewhat similar to the S&P500 although any potential upside appears to
face more of a challenge in the nearer term. Yesterday’s price action witnessed a convincing break
above the horizontal level of resistance (3342) however, early price action this morning appears to be
pulling back after yesterday’s advance.
Looking at the 50 and 200 simple moving averages, the recent ‘death cross’ reveals a rather bearish
outlook for the index.
A move lower, towards the 3342 zone of support (highlighted in orange) appears to be key
in determining a bearish continuation or a bullish move towards the descending trendline which is acting
as support. A pullback and hold above 3342 may entice bulls and a breakdown of the 3342 level aligns
with a bearish continuation scenario.
Dow Jones Daily Chart