S&P 500 and Nasdaq 100 Push Higher as Risk Sentiment Continues its Recovery

US STOCKS OUTLOOK:
- The S&P 500 gains and rises for third consecutive day
- The Nasdaq 100 rallies 1.58% and reaches its highest level since February 10
- Despite improving market sentiment, the outlook remains highly uncertain for equities
Most read:US Bond Yields Biased Higher on Hawkish Fed, SHY at Risk of Further Losses
S&P 500 and Nasdaq: U.S. stocks struggled to find direction and swung between small gains and losses for most of the day on Monday, but picked up momentum in late trading to end the day sharply higher. At the market close, the S&P 500 rose 0.71% to 4,575, climbing for the third day in a row, boosted by a strong rally in Tesla shares, which soared 8% after the company said it will seek shareholder approval to split its stock to pay dividends.
For its part, the cyclically oriented Dow Jones clambered 0.27% to finish the session near the 34,955 zone, after a stretch of the Treasury curve inverted, with 5s30s spread falling briefly to -2 bps, the first negative reading since March 2006. Meanwhile, the Nasdaq 100 outperformed its peers, rallying 1.58% to 14,987, its best level since February 10, as a deep sell-off in oil induced by China’s new lockdown eased some concerns about soaring consumer prices.
S&P 500 and Nasdaq
With the VIX in correction mode and hugging the 20-handle, sentiment appears to be on the mend after so much pessimism earlier this month, but the improved mood may not last long amid tighter monetary policy, red-hot inflation, weakening economic activity and rising geopolitical risks.
As the first quarter comes to an end, Corporate America will soon begin releasing revised profit forecasts ahead of the start of the new earnings season. It is too early to draw broad conclusions, but preliminary data compiled by FactSet indicates that S&P 500 companies are issuing negative EPS guidance at the highest rate since the fourth quarter of 2019, with most of the downgrades concentrated in the industrials and information technology sector so far. If this trend consolidates in the coming days and weeks, stocks will struggle to push higher and to build on the recovery seen over the past couple of weeks.
S&P 500 TECHNICAL ANALYSIS
The S&P 500 broke above Fibonacci resistance at 4,550 and now appears to be headed for the 4,600 area after Monday’s rally. If bulls manage to clear this barrier decisively in the coming days, the index could be on its way to recapture the 4,750 level. On the flip side, if bullish momentum wanes and sellers return, the first support to consider appears at 4,550, followed by 200-day simple moving average near 4,466. On further weakness, the next floor rests at 4,420.

NASDAQ 100 TECHNICAL ANALYSIS
The Nasdaq 100 climbed above the 50% Fibonacci retracement of the November 2021/March 2022 decline on Monday, a bullish signal for price action. If this breakout is sustained, the tech benchmark could find the impetus to challenge its 200-day SMA near 15,130 in the coming days. If price manages to venture atop this resistance, 15,345 will become the next upside focus.On the other hand, if the Nasdaq 100 pivots lower, technical supports sits at 14,901, but if this area fails to hold, there is scope for a pullback towards 14,456.

EDUCATION TOOLS FOR TRADERS
Are you just getting started? Download the beginners’
Would you like to know more about your trading personality?
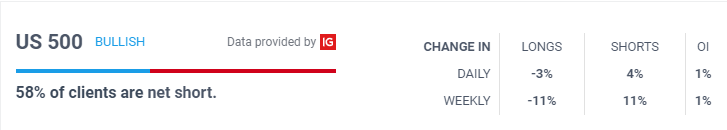
IG’s client positioning data provides valuable information on market sentiment.