S&P 500 Index: S&P 500 Retreats Amid Rate Hike Fears, Hang Seng and ASX 200 May Follow Lower
S&P 500 Index: S&P 500 Retreats, NIKKEI 225, ASX 200 WEEKLY OUTLOOK:
- S&P 500 Index: Dow Jones, S&P 500 and Nasdaq 100 indexes closed -0.01%, -0.41% and -0.96% respectively
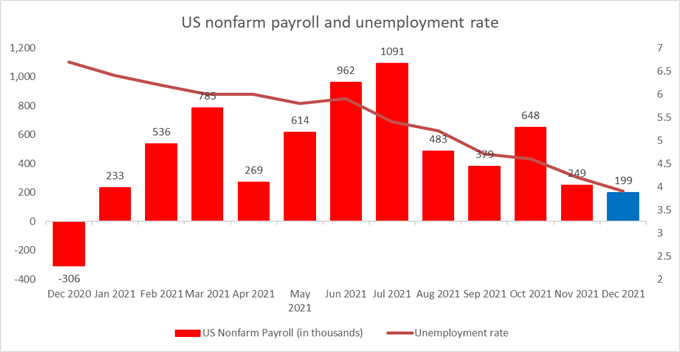
- US nonfarm payrolls increase came in below expectations, but unemployment rate and wage growth showed solid evidence of a tight labor market condition
- Asia-Pacific futures are pointing to a sour start of the week. Japanese stock markets are closed
Jobs report, Rate hikes, Treasury Yields – Asia-Pacific Week-Ahead:
Wall Street stocks ended the week on a sour note, with the Nasdaq, the S&P 500 and the Dow Jones indices falling -4.53%, -1.87% and -0.29% respectively last week. Technology stocks were hit the hardest as comparatively riskier growth shares are more sensitive to interest rate hike expectations compared to other sectors.
Some market participants may still view this pullback as another healthy correction and potentially an opportunity to buy more as the economy has shown good signs of improvement. Friday’s US jobs report showed that the unemployment rate has fallen to 3.9% – which is getting close to pre-pandemic levels. Wagesgrew 0.6% on the month in December, accelerating from November’s reading of 0.4%. Nonfarm payrolls came in at 199k, alongside upward revisions in the previous two months.
S&P 500 Index: This suggests that the labor market is facing pent up demand and may feed into inflationary pressure, spurring the Fed to raise interest rate as soon as March. Meanwhile, strong consumer spending maysupport corporate earnings and this positive feedback loop may help the economy to withstand the gradual interest rates liftoff this year. Besides, this week’s US core inflation data will also be in the spotlight.
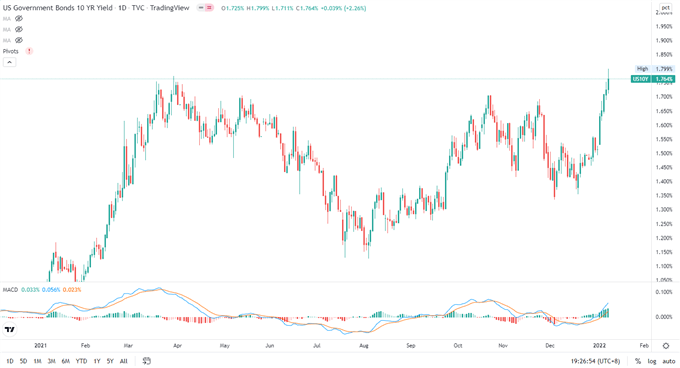
The US10-year Treasury yield climbed to the highest level since January 2020, as expectations for Fed rate hikes lifted the yield curve. The rate on 10-year US Treasuries is an important benchmark and is referenced by many other bonds and assets. Therefore, higher yields may exert downward pressure on highly leveraged corporates, rate-sensitive commodities and emerging market assets.
S&P 500 Index: US 10-Year Treasury Yield
APAC markets look set to kick off the week on the back foot. Futures were lower in the US, Australia, South Korea, Taiwan, Singapore and Thailand. Those in mainland China, Hong Kong, Malaysia, India and Indonesia are in the green however.
S&P 500 Index: The rapid spread of the Omicron variant may also cause some concerns about broader reopening among investors. The total number of Covid-19 cases around the world surpassed 300 million on Friday. The emergence of highly contagious viral variants such as Delta and Omicron means that the fight against the pandemic may be far from over.
For the week ahead, the US core inflation rate and retail sales data dominate the economic docket alongside the German full-year GDP report. Find out more from the wavesscoutforex.
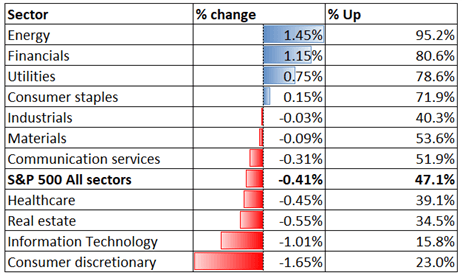
Looking back to Friday’s close, 4 out of 11 S&P 500 sectors ended higher, with 47.1% of the index’s constituents closing in the green. Energy (+1.45%), financials (+1.15%) and utilities (+0.75%) were among the best performers, whereas consumer discretionary (-1.65%) and information technology (-1.01%) trailed behind.
S&P500Index Technical Analysis
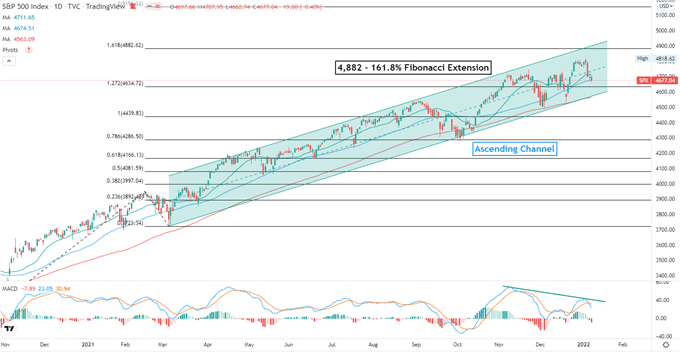
The S&P 500 index pull backed from all-time highs, which may be another healthy correction alongside its upward trajectory. The overall bullish trend remains intact, as suggested by an “Ascending Channel” formation. The next resistance level can be found at 4,882 – the 161.8% Fibonacci extension. The MACD indicator formed a lower high however, suggesting that near-term momentum may be weakening.
S&P 500 Index – Daily Chart
Hang Seng Index Technical Analysis:
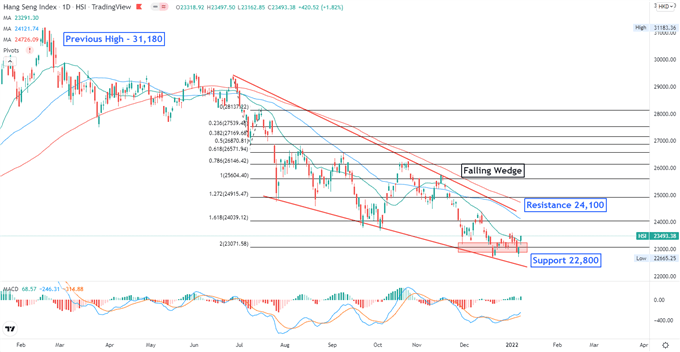
The Hang Seng Index (HSI) trended lower within a “Falling Wedge” pattern, as highlighted in the chart below. Prices are testing an immediate support level at 22,800 – the 200% Fibonacci extension. Holding above this level may pave the way for a technical rebound. The MACD indicator is trending higher below the neutral midpoint, suggesting that bullish momentum may be building.
S&P 500 Index: Hang Seng Index – Daily Chart
ASX 200 Index Technical Analysis:
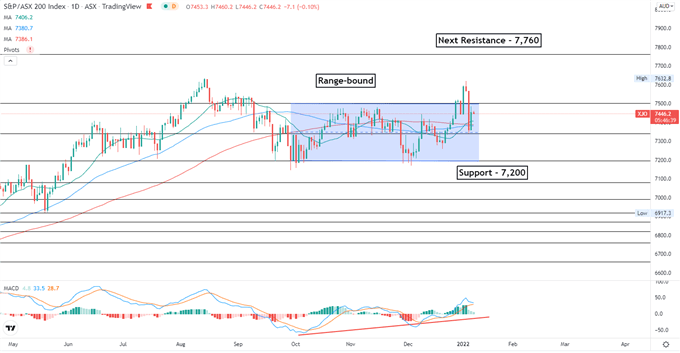
The ASX 200 index pulled back to a range-bound zone between 7,200 to 7,500 after a ‘false breakout’ last week. The floor and ceiling of the range may be viewed as immediate support and resistance levels respectively. The overall trend remains bullish-biased, as the MACD indicator pierced through the neutral midpoint and moved higher. A meaningful breach above 7,500 may intensify buying pressure and expose the next resistance level of 7,760.
ASX 200 Index – Daily Chart