Sterling Technical Forecast: GBP/USD Breakout Exhaustion- Cable Levels
STERLING (GBP/USD) TECHNICAL PRICE OUTLOOK: NEUTRAL
- Sterling technical trade level update – Weekly Chart
- GBP/USD breakout runs into key technical confluence at the 52-week moving average
- Weekly resistance 1.3746 (key), 1.3835 – support 1.3567, 1.3494-1.3529 (key)
Sterling Forecast: GBP/USD: The British Pound has now surged more than 4.3% off the December 2021 low against the US Dollar with GBP/USD stretching into confluent technical resistance on Thursday. The advance may be vulnerable here in the days ahead and we’ll be looking for support next week to validate this potential price breakout. These are the updated targets and invalidation levels that matter on the GBP/USD weekly chart. Review my latest Strategy Webinar for an in-depth breakdown of this Sterling technical setup and more.
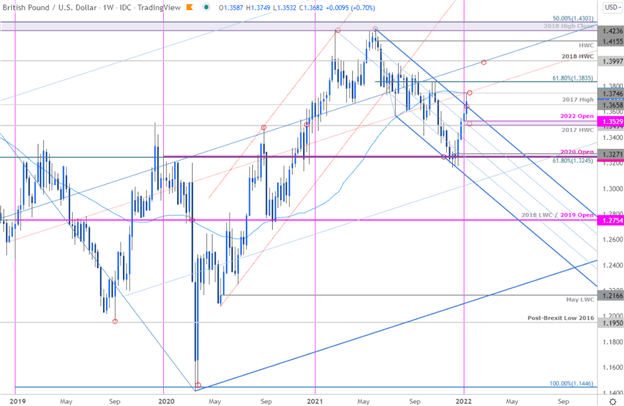
Sterling Forecast: GBP/USD: Notes:In my last Sterling Technical Forecast we noted that GBP/USD was approaching weekly resistance at, “the upper parallel of the descending pitchfork we’ve been tracking off the 2021 highs / 2017 swing high at 1.3658– a breach / weekly close above this threshold is needed to keep the immediate rally viable with such a scenario exposing confluent resistance around the 52-week moving average near ~1.3750s.” A topside breach yesterday registered a high today at 1.3749 – time for exhaustion?
The focus is on possible near-term inflection up here with the immediate advance vulnerable while below. Weekly support rests with the 2017 high-week close / 2022 yearly open at 1.3494-1.3529 – a weekly close below this threshold would suggest this may have been a larger flush-out and would shift the focus towards resumption for the broader downtrend. A topside breach / close above this key resistance threshold is needed to validate a larger reversal with such a scenario exposing the 61.8% Fibonacci retracement of the May decline at 1.3835 and the 2018 high-week close at 1.3997 – both areas of interest for possible topside exhaustion IF reached.
For a complete breakdown of Michael’s trading strategy, review his Foundations of Technical Analysis series on Building a Trading Strategy
Bottom Line:Sterling has stretched into confluent resistance and while this breakout does threaten a larger advance, the immediate rally may be vulnerable while below 1.3746- watch the weekly close. From at trading standpoint, a good zone to reduce long-exposure / raise protective stops – losses should be limited to the February low at 1.3567 IF price is heading higher on this stretch. I’ll publish an updated Sterling Price Outlook once we get further clarity on the near-term GBP/USD technical trade levels.
STERLING TRADER SENTIMENT - GBP/USD PRICE CHART
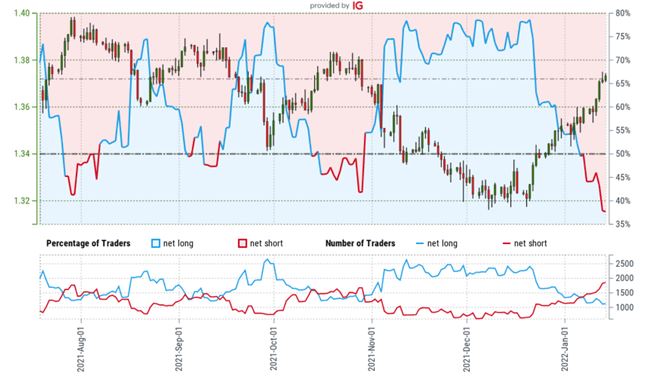
- A summary of IG Client Sentiment shows traders are net-short GBP/USD – the ratio stands at -1.59 (38.54% of traders are long) – typically bullish reading
- Long positions are 1.52% higher than yesterday and 13.57% lower from last week
- Short positions are4.63% higher than yesterday and 37.73% higher from last week
- We typically take a contrarian view to crowd sentiment, and the fact traders are net-short suggests GBP/USD prices may continue to rise. Traders are further net-short than yesterday and last week, and the combination of current positioning and recent changes gives us a stronger GBP/USD-bullish contrarian trading bias from a sentiment standpoint.