S&P 500 Index Pulls Back on Hawkish Fed Comments, APAC to Open Lower
- Dow Jones, S&P 500 and Nasdaq 100 indexes closed -0.49%, -1.42% and -2.51% respectively
- Several Fed officials highlighted the need for three or four rate hikes this year to tackle inflation
- Asia-Pacific markets are positioned to open lower following a negative lead from Wall Street
Fed Comments, US Jobless Claims, Tech Pullback, Bank Earnings, Asia-Pacific at Open:
S&P 500 Index: Wall Street equities pulled back Thursday as investors mulled hawkish comments by several Fed officials with regards to interest rate hikes and balance sheet normalization. The rate-sensitive technology sector led the decline, with the Nasdaq 100 index falling to its lowest level since October.
Several Fed members supported the idea of a March hike and believe that three or more rate increases are appropriate to contain rising price levels this year. Fed Bank of Philadelphia President Patrick Harker said that the central bank should consider balance sheet normalization after interest rates are sufficiently above zero. This came against the backdrop of a tightening labor market and four-decade high inflation reading in December.
S&P 500 Index:
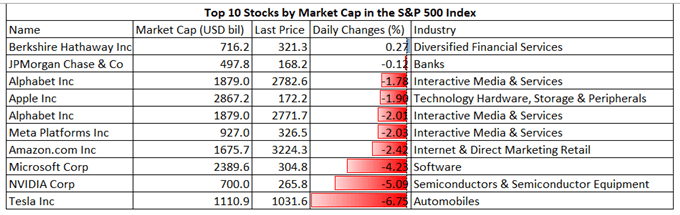
Defensive-oriented sectors such as utilities, consumer staples and real estate outperformed cyclical ones overnight. Tesla (-6.75%), NVIDIA (-5.09%) and Microsoft (-4.12%) were among the worst performing large-cap companies in the S&P 500 index on Thursday.
The financial sector exhibited resilience against the selloff, as banks may be benefiting from higher interest rates due to wider net interest margin. This put today’s bank earnings release in the spotlight, with JPMorgan, Wells Fargo and Citigroup due to report their Q4 results. Investors will look for their forward guidance and projections of the impact of interest rate hikes on profits.
S&P 500 Top 10 Stock Performance 13-01-2022
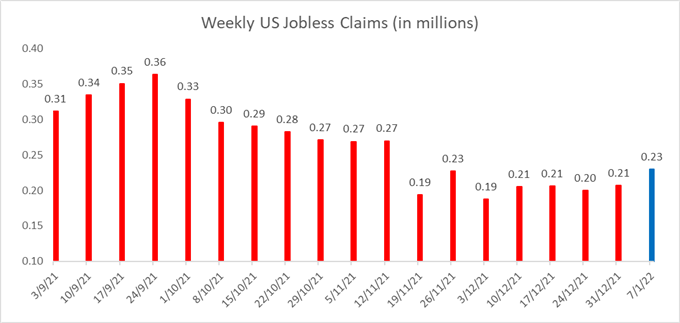
S&P 500 Index: Meanwhile, weekly initial US jobless claims data came in at 230k, compared to a 200k estimate. The unemployment claims have been creeping higher last week, but the overall level is still substantially lower than the pandemic-era averages. This underscores a strong labor market condition that may warrant a steady increase in the Fed’s target fund rates.
US Weekly Jobless Claims
Asia-Pacific markets look set to open lower on Friday following a sour lead from Wall Street. Futures in Japan, mainland China, Australia, Hong Kong, South Korea, Singapore, India are in the red, whereas those in Taiwan, Malaysia, Thailand are in the green. Chinese tech stocks listed in the US tumbled overnight, including Tencent (-4.8%), Alibaba (-4.4%) and JD.COM (-6.49%).
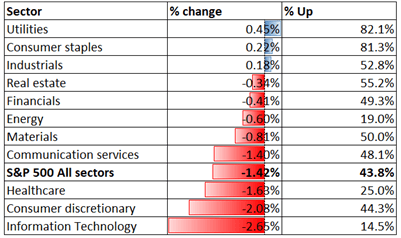
Looking back to Thursday’s close, 8 out of 11 S&P 500 sectors ended lower, with 56.2% of the index’s constituents closing in the red. Information technology (-2.65%), consumer discretionary (-2.08%) and healthcare (-1.63%) were among the worst performers, whereas defensive-linked utilities (+0.45%), consumer staples (+0.22%) registered small gains.
S&P 500 Sector Performance 13-01-2022
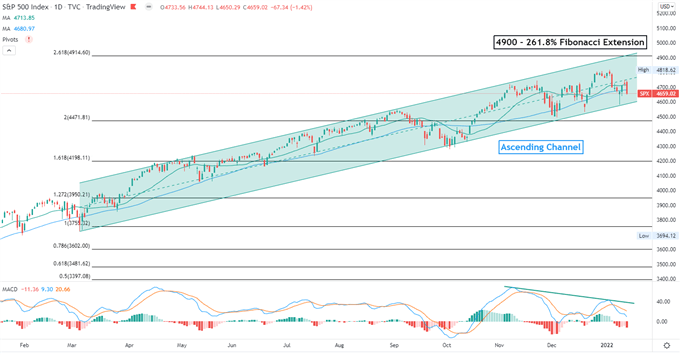
S&P 500 Index Technical Analysis
The S&P 500 index pull backed from all-time highs, which may be another healthy correction alongside its upward trajectory. The overall bullish trend remains intact, as suggested by an “Ascending Channel” formation. The next resistance level can be found at 4,900 – the 261.8% Fibonacci extension. The MACD indicator formed a lower high however, suggesting that near-term momentum may be weakening.
S&P 500 Index – Daily Chart
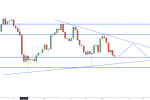
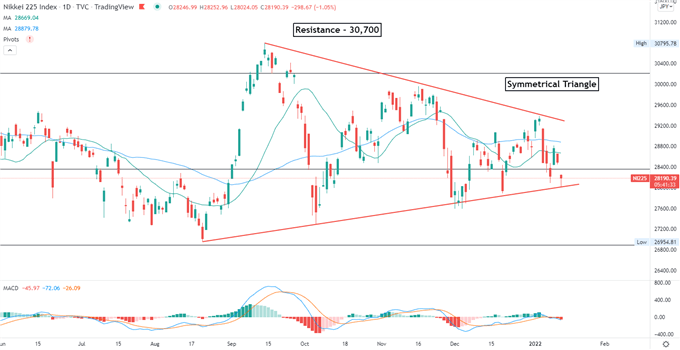
Nikkei 225 Technical Analysis:
The Nikkei 225 index is hovering within a “Symmetrical Triangle” pattern over the past few month, waiting for fresh catalysts for a decisive breakout. The September high of 30,700 serves as a key resistance level, whereas the lower trendline may provide some near-term support. The MACD indicator is about to form a bearish crossover beneath the neutral midpoint, suggesting that near-term momentum remains weak.
Nikkei 225 Index – Daily Chart
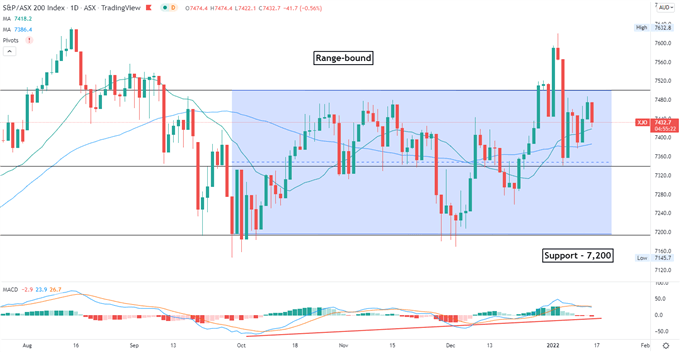
ASX 200 Index Technical Analysis:
The ASX 200 index pulled back to a range-bound zone between 7,200 to 7,500 after a ‘false breakout’ last week. The floor and ceiling of the range may be viewed as immediate support and resistance levels respectively. A meaningful breach above 7,500 may intensify buying pressure and expose the next resistance level of 7,760.
ASX 200 Index – Daily Chart