AUSTRALIAN DOLLAR, AUD/USD, CHINA TRADE BALANCE – MARKET ALERT
- Australian Dollar brushes aside surging China trade surplus
- This was driven by a material slowdown in import figures
- China’s external sector may be at risk of fading US demand
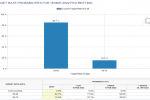
AUD/USD CHINA TRADE BALANCE: The Australian Dollar showed a relatively mute reaction to December Chinese trade figures. Slightly higher export figures (20.9% y/y vs. 20% seen) and lower-than-expected import data (19.5% vs 27.8% seen) helped drive China’s trade surplus to US$94.46b versus 73.95b anticipated. As this data is used to calculate GDP, today’s positive reading may offer a boost to the nation’s economy.
According to Bloomberg, China posted a record 4.36 trillion Yuan trade surplus last year. This is largely thanks to surging exports, which likely offset some of the economic headwinds from the Evergrande crisis and government crackdowns on the technology and education sectors. With that in mind, the road ahead in 2022 could look tough for China’s external sector.
AUD/USD CHINA TRADE BALANCE:
A key driver of Chinese export demand is United States consumption. Growth is expected to slow in the world’s largest economy compared to 2021 amid fading fiscal and monetary stimulus. Meanwhile, easing Covid restrictions could shift demand slowly away from physical goods to services. This is as China may use relatively stricter lockdowns. With that in mind, slowing Chinese exports could dent the Yuan.
As for the Australian Dollar, which tends to be the market’s preferred liquid China proxy, it will probably be more important to monitor Chinese imports. China is Australia’s largest trading partner. Slowing growth in the world’s second-largest economy may weaken demand for Australian goods. This has been the case, with geopolitical tensions between the two denting China imports from Australia since September.
AUSTRALIAN DOLLAR TECHNICAL ANALYSIS
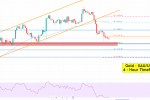
From a technical standpoint, the Australian Dollar appears to be trading within a Bear Flag chart formation. If AUD/USD manages to break under the floor of the near-term rising channel, this could open the door to resuming losses from November. Immediate resistance appears to be the 61.8% Fibonacci retracement level at 0.7341.
AUD/USD DAILY CHART