Double Doji Trading Strategy; part 2
Double Doji Trading Strategy; As we’ve noted earlier, the Doji pattern is one that is characteristic of indecision in the market. As such, most Doji patterns by themselves are not very telling. However, when the market you are trading forms multiple Dojis in consecutive fashion; this can be an extremely opportune time to take advantage of a breakout trade.
More specifically, remember that most Doji patterns are generally indecision patterns, and thus when we have two or three Dojis appearing one after another; then that is indicative of a prolonged period of indecision. which is likely to propel prices in the direction of the eventual breakout. This is because the markets ebb and flow through periods of low volatility to high volatility. from periods of high volatility to low volatility.
With this backdrop, we will create a strategy for trading the Doji pattern that will take advantage of these periods in the market. Our strategy is based on a double Doji pattern; which is essentially any two consecutive Dojis appearing on the price chart. They should preferably be of a similar Doji variation; however, this is not a requirement. This double Doji system is a very simple price action-based strategy that requires nothing more than the presence of two consecutive Doji patterns.
what is Double Doji?
So here are the rules for trading the Double Doji set up:
- A Double Doji pattern must appear near the top of an uptrend or the bottom of a downtrend.
- Plot a support line at the low of the double Doji pattern, and a resistance line at the high of the Double Doji pattern.
- Place an OCO order, one cancels the other order, one pip above the resistance high and one pip below the support low.
- Wait for a breakout either above the resistance level which will execute the buy side of the order; or below the support level which will execute the sell side of the order. If the buy order is triggered first; then place a stop just below the low of the double Doji pattern. If they sell order is triggered first. then place a stop just above the high of the double Doji pattern.
- We will utilize a two-tiered exit strategy. That is to say that target one will be placed at a level that is equivalent to the height of the Double Doji pattern. We will close out 1/2 the position at Target 1. Target two will be placed at a level that is equivalent to twice the length of the Double Doji pattern. We will close out the second 1/2 of our position at Target 2
Let’s now shift our attention to highlighting some actual examples of the Doji pattern set up on a few price charts. We’ll look at a few Double Doji patterns in the Forex market.
As we can see from the price chart below, the price of GBPUSD was trading lower. then we see a period of consolidation before another price level is lower that ultimately leads to the formation of a double Doji pattern on the price chart. You can see the double Doji pattern circled in green.

Bullish Doji Candlestick Trade Setup- GBPUSD
We will now draw the support and resistance lines for the double Doji pattern. Notice the second candle within this double Doji pattern put in high of the entire pattern; and also the low of the entire pattern. As such, we will plot our support line at the low of this candle; and the resistance line at the high of the candle creating our breakout levels.
Now that our breakout levels have been plotted; we will place an OCO order; one cancels the other order; with a buy stop, one pip above the high, and a sell stops one pip below the low of the support line. Once we’ve done this, we’ll wait to see which way the price action breaks out.
As we can see, the third bar following the formation of the double Doji pattern signaled the breakout to the upside executing the buy-side of our OCO order putting us into a long position in the currency pair. And so, we will place a stop loss just below the low of the double Doji pattern as noted on the chart.
We will be using a two-tiered target as an exit strategy which calls for the first exit to be taken upon price reaching an equivalent distance of the double Doji pattern. Notice the second orange bracket which represents Exit 1. Price easily reach this level and continued to move higher. Exit 2 can be seen just above Exit 1 and represents a length of twice the double Doji pattern. Here again, the price reach that level quite quickly after Exit 1 was achieved taking us out of the position entirely with a great result.
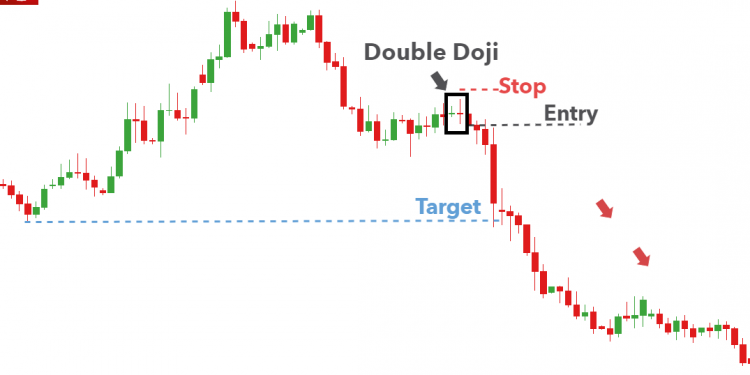
Bearish Doji Candlestick Trade Setup – USDCAD
Let’s now look at another example of this strategy in action. This time will be referring to the price chart for the US Dollar to Canadian Dollar Forex pair as seen on the daily timeframe.

Looking at the lower left of the price chart, we can see that prices were moving higher; forming an up-trending market scenario. Towards the middle of the price chart, we can see a Double Doji pattern form, which is circled in green. This Double Doji pattern was quite clear and would have clued us in to a potential trade setup using the strategy. Unlike the previous example; this Double Doji pattern appears at the top of an uptrend.
With these conditions being met, we can now go ahead and plot our support and resistance lines for the Double Doji pattern. Note that within this double Doji structure; the initial Doji pattern creates the high for the entire pattern. while the second Doji pattern creates the low for the entire pattern. As such, we will use the first Doji high to plot the resistance level, and the second Doji low to plot the support level.
Double Doji Trading Strategy
Now we will go ahead and place our OCO order, one cancels the other, one PIP above the high as represented by the upper black dashed line. tone PIP below the low as represented by the lower black dashed line. Once we’ve done that we would go ahead and wait until the price either breaks above the resistance level or below the support level to enter into the position.
In this case, the price immediately breaks lower on the very next candle following the double Doji formation. You can see that sell entry is noted on the price chart. Now that we are in this position, we will make sure to protect ourselves in case of an adverse price move by placing a stop-loss order in the market. Based on our strategy rules, the stop will be placed just above the high of the double Doji formation.
Our two-tiered exit strategy calls for placing a target at a length that is equivalent to the double Doji pattern projected lower from the breakout point. This will serve as our target for Exit 1. Notice how two candles following the breakout Exit 1 was reached providing us some profits on this trade. However, soon after Exit 1 was reached prices traded slightly lower, and then began to reverse to the upside.
Final Thoughts
As a result, our target 2 was never reached on this trade. Remember target 2 is set at a level that is equivalent to twice the length of the double Doji pattern. Instead, as the price reversed and move higher, our stop loss was eventually triggered, taking us out of the position. In this trade, we wound up with a breakeven situation. because we were able to reach Exit 1, however, we gave back those profits when our stop loss was hit.
Candlestick analysis is at the heart of many price action-based trading strategies. There is a myriad of candlestick patterns that chart traders should be aware of. In this lesson; we’ve covered one of those important candlestick patterns – the Doji pattern. And as we learned, there are different variations of the Doji pattern as well.
Beginning traders and students of the market should take some time to practice recognizing this important pattern as it is commonly seen within the price chart. Knowing when and where the Doji pattern occurs can give traders some insights into what is occurring behind the scenes in the market.