What The Doji Candlestick Pattern Reveals; part 1
The Doji Candlestick Pattern; One of the most common subsets of price action trading involves the use of candlestick patterns. Candlestick patterns offer valuable insights into the market action and can help traders position for the next price move. There are literally dozens of different candlestick patterns that traders can follow. One of the more common formations within this class of patterns is the Doji candlestick, which will be the focus of this article.
What Is The Doji Candlestick Pattern?
Within technical analysis, a Doji is classified as a single candlestick pattern wherein the open and close of a specified instrument forgive period is essentially the same or very close to it. As a result of this, the appearance of a Doji often takes the shape of a cross or some variation of it.
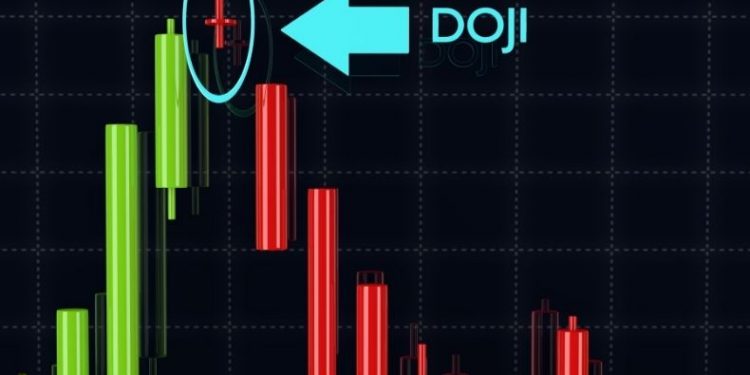
Because the Doji candle opens and closes in virtually the same location, that is indicative of indecision in the market. The bulls and bears are battling it out to take control of the market, however, neither was successful in their attempt to overwhelm the other and move the market in their direction. Below you can see an example of a Doji pattern.

Unlike most candlestick patterns that either have a bullish implication or bearish implication, the Doji pattern is somewhat different in that the formation does not provide any clear insights into the future price movement of a security. Essentially, the Doji candlestick pattern is a neutral pattern. Sometimes they can appear as a continuation pattern suggesting further price movement in the direction of the trend, or they can appear as a reversal pattern suggesting that a trend reversal is most likely.
be quite useful
When the Doji formation is coupled with the underlying trend in the market or some other technical-based tools, we can in fact gather quite a bit of information from that and arrive at some bias for future price movement. And so, Doji candlesticks by themselves are not of much practical use, however, when coupled with other tools they can be quite useful.
There are several variations of the Doji candlestick. The major types of Doji patterns include the Doji Star, Gravestone Doji, Long Legged Doji, Dragonfly Doji, and the Four Price Doji. We will be describing each of these Doji variations in the upcoming sections and illustrate the structure of each. Since each of these can have a different potential depending on the market context, it’s important to study them so that you can recognize and label them correctly on your price chart.
Some traders find the Doji formation to be a bit frustrating to trade because there is no clear bullish or bearish signal provided from it as a standalone pattern. But as you will learn shortly, there is a great deal of value that this pattern can offer traders if it is evaluated and implemented correctly. This is particularly true when the market displays a Double Doji or Triple Doji formation, wherein there are subsequent Dojis appearing in the price series.
Doji patterns can appear in all major markets including the foreign exchange market, the futures market, the equities market, and more. And they appear across all different time frames from the very smallest to the very largest. As we noted earlier the Doji pattern will have approximately the same opening and closing price. This is a very important component of a Doji pattern.
Types Of Doji Candlestick Patterns
Traders need to use some common sense and judgment when defining how much differential between the opening and closing price they will accept for identifying a valid Doji pattern. This is because the exact opening and closing price for any given session is quite rare; therefore, we have to make room for some leeway in this area.
Because of the close proximity between the opening and closing price, the Doji will appear to have a very small body and resemble some variation of a cross. Let’s now introduce each of the different Doji patterns and their characteristics.
Doji Star – The Doji star pattern appears as a cross shape formation. The opening and closing prices will be virtually the same, with the upper and lower wicks within the candle appearing relatively small and equal in length. The Doji Star pattern indicates indecision in the market; wherein the bulls and bears are fighting for control however the market at the current juncture is at a level of equilibrium. You can see an illustration of the Doji star pattern below.

Gravestone Doji – The Gravestone Doji pattern appears as an upside-down T pattern. Candlestick traders will recognize this pattern to be somewhat similar to the shooting star pattern. However, the Gravestone Doji pattern is a more powerful bearish reversal signal; as they open and close are at or near the low after prices were rejected to the upside.
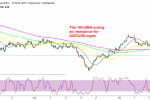
This is particularly true when the Gravestone Doji pattern appears in the context of an up-trending market condition. In this case, it signals a potential change of trend from bullish to bearish. Below you can see an example of the Gravestone Doji chart pattern.

Some traders find the Doji formation
Long Legged Doji – The Long-Legged Doji pattern has a similar appearance to the traditional Doji star pattern. They open and close occur at or near the same level. however, within the Long Leg Doji pattern, the wicks on either side are larger and extend out further. This suggests that the market is more volatile as prices were able to extend relatively far both to the upside and downside.
The implication is still one of indecision in the market; but wherein there is heightened volatility. This can often lead to large moves as prices break out from one side or the other.
You can refer to the image below to see an illustration of the Long-Legged Doji pattern.

technical analysis
Dragonfly Doji – The Dragonfly Doji pattern is the inverse of the Gravestone Doji pattern. That is to say that it appears as a T formation. The open and close occur near the high of the candle; with a relatively long wick to the bottom, suggesting rejection of lower prices. a strong close for the bulls. Dragonfly Dojis appear similar to a hammer candlestick; however, the Dragonfly Doji can prove to be more powerful of a signal; particularly when the Dragonfly Doji appears near the bottom of a down-trending market. The expectation is for higher prices following the completion of the Dragonfly Doji pattern. An example of the Dragonfly Doji pattern is shown below.

Four Price Doji – The Four Price Doji is a unique structure in and of itself. It appears as a horizontal line with very minor or nonexistent upper and lower wicks. As such; this pattern suggests that there is indecision in the market. the market is displaying characteristics of a low volatility environment. This is because prices open and close at or near the same area with very little movement to the upside or downside during that session. Learn What Works and What Doesn’t In the Forex Market. Join My Free Newsletter Packed with Actionable Tips and Strategies To Get Your Trading Profitable.
The Four Price Doji is seen much less frequently than the other types of Doji patterns presented earlier. Regardless, traders should take heed when such a formation appears on the price chart. Here is what the Four Price Doji looks like.