USD/JPY Price Analysis: Hits fresh monthly high, eyeing ascending channel resistance
- A combination of factors pushed USD/JPY to a fresh monthly high on Monday.
- A positive tone around the equity markets undermined the safe-haven JPY.
- A goodish pickup in the USD demand provided an additional boost to the pair.
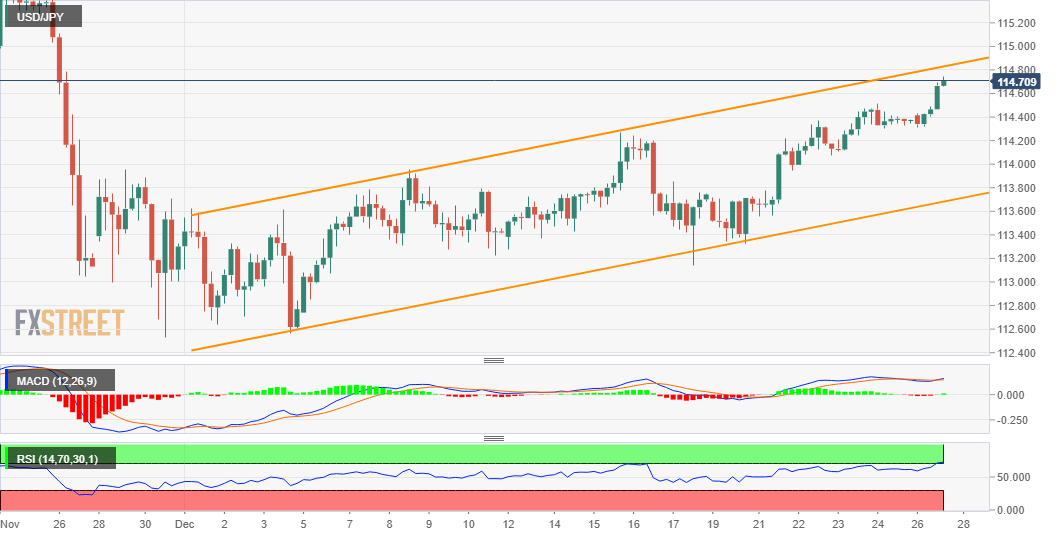
USD/JPY Price Analysis: The USD/JPY pair continued gaining traction through the mid-European session and shot to a fresh monthly high, around the 114.70-75 region in the last hour.
The US dollar made a solid comeback on the first day of a new trading week and remained well supported by the Fed’s hawkish outlook, indicating at least three-rate hikes next year. Apart from this, a positive tone around the equity markets undermined the safe-haven Japanese yen and provided a goodish lift to the USD/JPY pair.
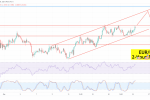
Looking at the broader picture, the recent move up witnessed since the beginning of this month has been along an upward sloping channel. This points to a well-established short-term bullish trend, which is reinforced by the fact that technical indicators on the daily chart are holding comfortably in the positive territory.
USD/JPY Price Analysis
The set-up supports prospects for a further near-term appreciating move, though bulls are likely to wait for a sustained strength beyond the trend-channel resistance. The mentioned barrier, currently near the 114.85 regions, is closely followed by the key 115.00 psychological mark, which if cleared will reaffirm the positive outlook.
The subsequent move up has the potential to lift the USD/JPY pair back towards November monthly swing high, around mid-115.00s, or the highest level since January 2017. The momentum could further get extended and allow bulls to aim back to reclaim the 116.00 round-figure mark.
On the flip side, the daily swing low, around the 114.30 regions, now seems to protect the immediate downside ahead of the 114.00 mark. Any subsequent decline should find decent support near the lower boundary of the mentioned channel, currently around the 113.75 regions, which should now act as a pivotal point for short-term traders.
USD/JPY 4-hour chart
Technical levels to watch
USD/JPY Price Analysis
| OVERVIEW | |
|---|---|
| Today last price | 114.73 |
| Today Daily Change | 0.35 |
| Today Daily Change % | 0.31 |
| Today daily open | 114.38 |
| TRENDS | |
|---|---|
| Daily SMA20 | 113.62 |
| Daily SMA50 | 113.89 |
| Daily SMA100 | 112.23 |
| Daily SMA200 | 110.93 |
| LEVELS | |
|---|---|
| Previous Daily High | 114.51 |
| Previous Daily Low | 114.3 |
| Previous Weekly High | 114.51 |
| Previous Weekly Low | 113.33 |
| Previous Monthly High | 115.52 |
| Previous Monthly Low | 112.53 |
| Daily Fibonacci 38.2% | 114.38 |
| Daily Fibonacci 61.8% | 114.43 |
| Daily Pivot Point S1 | 114.28 |
| Daily Pivot Point S2 | 114.19 |
| Daily Pivot Point S3 | 114.07 |
| Daily Pivot Point R1 | 114.49 |
| Daily Pivot Point R2 | 114.61 |
| Daily Pivot Point R3 | 114.7 |