Euro Technical Analysis: Divergence Among EUR/GBP, EUR/JPY, EUR/USD

EURO OUTLOOK:
- Each major EUR-cross has its own story to tell; there’s no consistent technical theme among EUR/GBP, EUR/JPY, and EUR/USD rates.
- Buying dips in EUR/JPY may be appropriate, as would selling rallies in EUR/USD. But the chart offers no discernible direction for EUR/GBP.
- Per the IG Client Sentiment Index, each of EUR/GBP, EUR/JPY, and EUR/USD rates have a mixed bias.
NO CONSISTENT NARRATIVE?
Euro Technical Analysis: Commodity markets remain highly volatile, leading to meaningful outperformances by the Australian, Canadian, and New Zealand Dollars compared to the European currencies. And while pairs like EUR/AUD, EUR/CAD, and EUR/NZD have seen significant losses in recent weeks, the same can’t be said for the trio of major EUR-crosses: EUR/GBP, EUR/JPY, and EUR/USD.
The relative stance of monetary policy among the major central banks may be the underlying theme, however. EUR/USD weakness has coincided with a surge in near-term Fed rate hike odds, for example. EUR/GBP’s stability has coincided with rates markets downplaying BOE hike odds in the near-term while holding out hope that the ECB will act later this year. And with the BOJ continuing its ultra-loose monetary policies in the face of rising energy costs, EUR/JPY is simply acting like all other JPY-crosses right now – a straight line up.
EUR/USD RATE TECHNICAL ANALYSIS: DAILY CHART (MARCH 2020 TO MARCH 2022) (CHART 1)
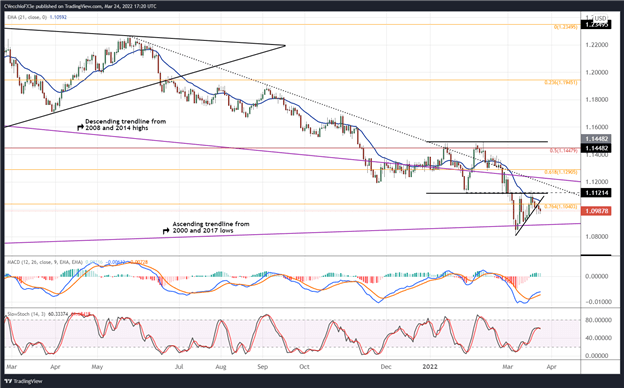
After the initial bearish breakout from the sideways range carved out in January and February, EUR/USD rates rebounded back to their breakout level before turning lower again. Bearish momentum is beginning to reassert itself, with EUR/USD rates below their daily 5-, 8-, 13-, and 21-EMA envelope, which is in full bearish sequential order. Daily MACD’s climb while below its signal line is slowing, and daily Slow Stochastics have just issued a sell signal. The double top is still in play, with the measured move pointing towards losses continuing below 1.0800.
IG CLIENT SENTIMENT INDEX: EUR/USD RATE FORECAST (MARCH 24, 2022) (CHART 2)
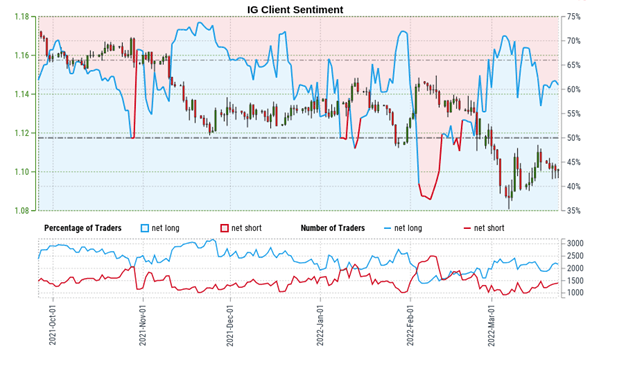
Euro Technical Analysis: EUR/USD: Retail trader data shows 61.42% of traders are net-long with the ratio of traders long to short at 1.59 to 1. The number of traders net-long is 1.50% lower than yesterday and 10.76% higher from last week, while the number of traders net-short is 3.24% higher than yesterday and 0.99% lower from last week.
We typically take a contrarian view to crowd sentiment, and the fact traders are net-long suggests EUR/USD prices may continue to fall.
Positioning is less net-long than yesterday but more net-long from last week. The combination of current sentiment and recent changes gives us a further mixed EUR/USD trading bias.
EUR/JPY RATE TECHNICAL ANALYSIS: DAILY CHART (MARCH 2021 TO MARCH 2022) (CHART 3)
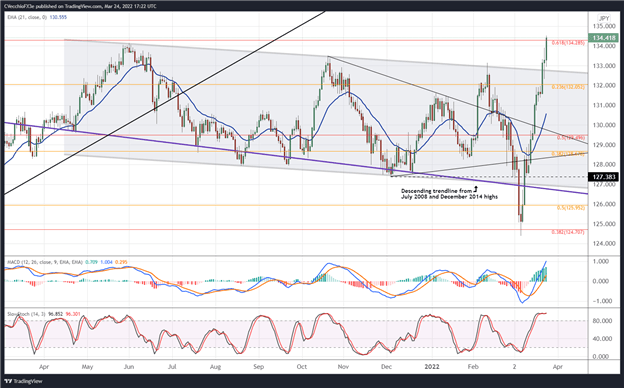
EUR/JPY rates have started to clear two important hurdles that suggest a considerable bullish rally is in its early stages: the 2021 high at 134.12; and the 61.8% Fibonacci retracement of the 2014 high/2016 low range at 134.29. The achievements suggest that the multi-month bull flag that formed after breaking above the descending trendline from the July 2008 and December 2014 highs has finally yielded a topside move that points to further strength in the weeks and months ahead. A return back to the flag breakout level near 132.80 isn’t out of the question, though; buying the dips is the preferred strategy henceforth.
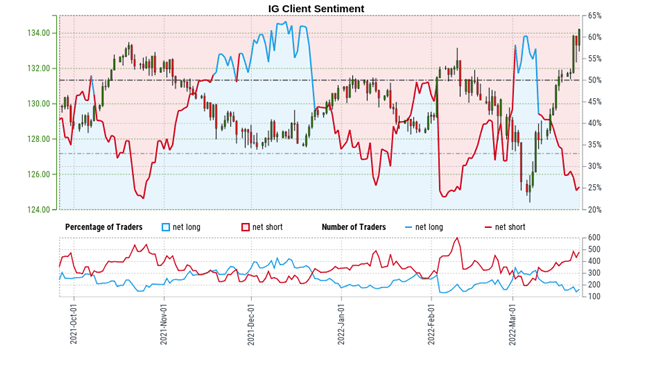
IG CLIENT SENTIMENT INDEX: EUR/JPY RATE FORECAST (MARCH 24, 2022) (CHART 4)
Euro Technical Analysis
EUR/JPY: Retail trader data shows 26.96% of traders are net-long with the ratio of traders short to long at 2.71 to 1. The number of traders net-long is 21.13% higher than yesterday and 11.79% lower from last week, while the number of traders net-short is 2.31% lower than yesterday and 23.61% higher from last week.
We typically take a contrarian view to crowd sentiment, and the fact traders are net-short suggests EUR/JPY prices may continue to rise.
Positioning is less net-short than yesterday but more net-short from last week. The combination of current sentiment and recent changes gives us a further mixed EUR/JPY trading bias.
EUR/GBP RATE TECHNICAL ANALYSIS: DAILY CHART (MARCH 2021 TO MARCH 2022) (CHART 5)
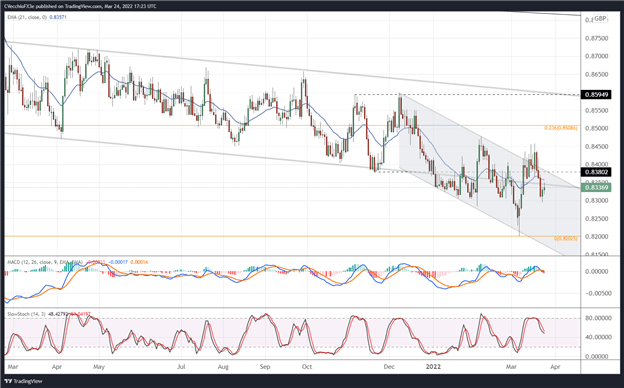
EUR/GBP rates experienced a false bullish breakout last week when they tried to climb through descending channel resistance in place against the December 2021 and February 2022 highs. But the return back into the channel lacks vigor, suggesting that the pair may not move back towards the yearly low set at 0.8203 in the near-future (barring a significant escalation in the Russian invasion of Ukraine, which could further disrupt commodities markets, thereby raising near-term inflation pressures and forcing the BOE’s hand into a more aggressive stance again). More clarity is needed before a directional bias is ascertained for EUR/GBP rates.
IG CLIENT SENTIMENT INDEX: EUR/GBP RATE FORECAST (MARCH 24, 2022) (CHART 6)
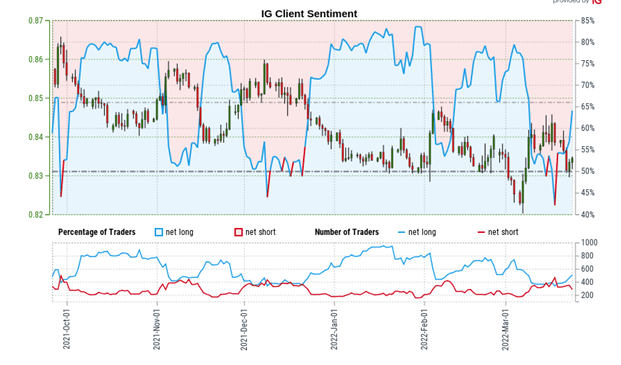
EUR/GBP: Retail trader data shows 62.84% of traders are net-long with the ratio of traders long to short at 1.69 to 1. The number of traders net-long is 1.94% higher than yesterday and 52.02% higher from last week, while the number of traders net-short is 7.24% higher than yesterday and 27.67% lower from last week.
We typically take a contrarian view to crowd sentiment, and the fact traders are net-long suggests EUR/GBP prices may continue to fall.
Positioning is less net-long than yesterday but more net-long from last week. The combination of current sentiment and recent changes gives us a further mixed EUR/GBP trading bias.