EUR/GBP Price Analysis: Extends bounce off 50-DMA above 0.8500

- EUR/GBP Price Analysis: EUR/GBP pokes intraday high, snaps two-day downtrend.
- Steady RSI line favor recovery moves towards 10-week-old resistance line.
- Key Fibonacci retracement levels, 200-DMA act as additional resistances.
EUR/GBP prints the biggest daily gains of the week, up 0.14% intraday around 0.8525 heading into Wednesday’s London open.
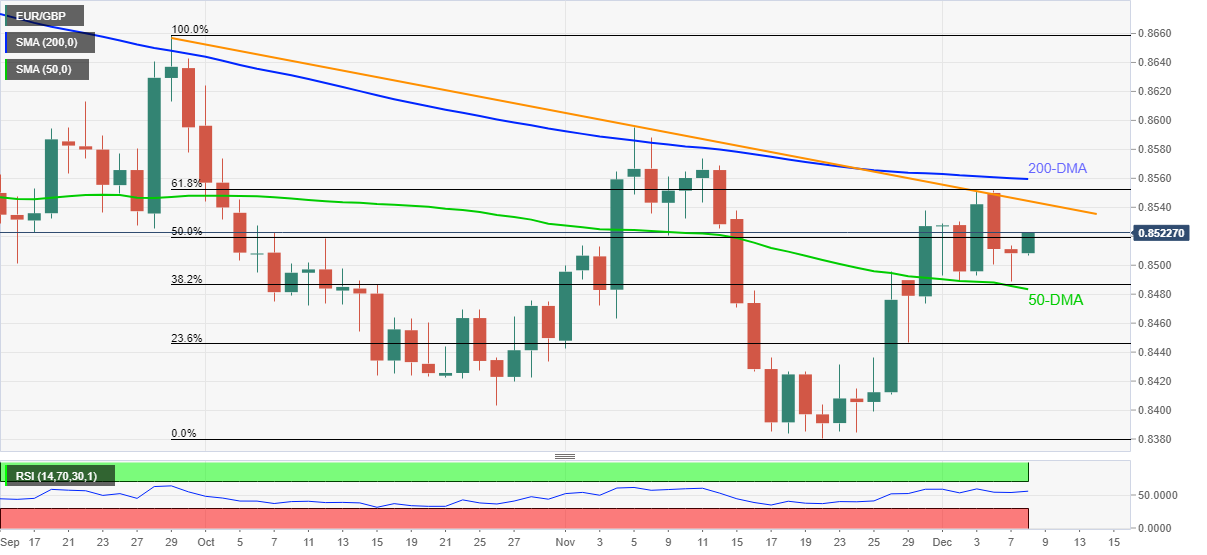
The cross-currency pair dropped to a one-week low the previous day before bouncing off 50-DMA. 38.2% Fibonacci retracement (Fibo.) of September-November declines.
Although the firmer RSI line favors the latest recovery; a clear break of the 50% Fibo. A level near 0.8520 becomes necessary for the bulls to keep reins.
Following that, a descending trend line from late October; and 61.8% Fibonacci retracement level; respectively around 0.8545 and 0.8555, will challenge the EUR/GBP buyers.
It should be noted, however, that the pair’s run-up beyond 0.8555 will need validation from the 200-DMA level of 0.8560.
Alternatively, a daily closing below the 50-DMA level around 0.8480 will highlight multiple supports around 0.8460 and 0.8420 for EUR/GBP sellers.
However, the pair’s weakness past-0.8420 will be challenged by November’s low of 0.8380; which is also the lowest level since early 2020.
EUR/GBP: Daily chart
Trend: Further recovery expected
EUR/GBP Price Analysis: ADDITIONAL IMPORTANT LEVELS
| OVERVIEW | |
|---|---|
| Today last price | 0.8521 |
| Today Daily Change | 0.0013 |
| Today Daily Change % | 0.15% |
| Today daily open | 0.8508 |
| TRENDS | |
|---|---|
| Daily SMA20 | 0.8473 |
| Daily SMA50 | 0.8486 |
| Daily SMA100 | 0.8516 |
| Daily SMA200 | 0.856 |
| LEVELS | |
|---|---|
| Previous Daily High | 0.8514 |
| Previous Daily Low | 0.8489 |
| Previous Weekly High | 0.8551 |
| Previous Weekly Low | 0.8446 |
| Previous Monthly High | 0.8595 |
| Previous Monthly Low | 0.8381 |
| Daily Fibonacci 38.2% | 0.8498 |
| Daily Fibonacci 61.8% | 0.8504 |
| Daily Pivot Point S1 | 0.8494 |
| Daily Pivot Point S2 | 0.8479 |
| Daily Pivot Point S3 | 0.8468 |
| Daily Pivot Point R1 | 0.8518 |
| Daily Pivot Point R2 | 0.8529 |
| Daily Pivot Point R3 | 0.8543 |