Gold Supported Over $1,806 – Check Out Sell Stop Order

Gold: On Tuesday, the precious metal, gold, is trading with a slightly bearish bias at the $1,806 level.
Gold: This is because the US Treasury Yields on the benchmark 10-year note fell, coming in at 1.51%. The US Dollar Index (DXY) also declined on Monday, dropping to 91.91, which helped the precious metal to remain high on the board. However, the yellow metal failed to benefit from the declining prices of the greenback and the slump in the Treasury Yields, and it remained flat for the day.
US NFP Ahead – Investors Exhibit Cautious Behavior
The steady movement of the yellow metal could be attributed to the cautious behavior of the investors, who are avioding taking any prominent positions ahead of the critical US non-farm payroll data due later this week.https://s.tradingview.com/widgetembed/?frameElementId=tradingview_ab74c&symbol=FOREXCOM%3AXAUUSD&interval=W&hidesidetoolbar=0&symboledit=0&saveimage=1&toolbarbg=f1f3f6&studies=%5B%5D&hideideas=1&theme=White&style=3&timezone=Etc%2FUTC&withdateranges=1&hidevolume=1&studies_overrides=%7B%7D&overrides=%7B%7D&enabled_features=%5B%5D&disabled_features=%5B%5D&utm_source=www.fxleaders.com&utm_medium=widget&utm_campaign=chart&utm_term=FOREXCOM%3AXAUUSD
Meanwhile, the growing concerns over the rising number of coronavirus cases, due to the Delta variant, limited the decline in the prices of the yellow metal, and the weak US dollar also supported the gold prices.
Quick Update on US Economic Events
On the data front, at 18:45 GMT, The Final Manufacturing PMI was released – it remained flat. in line with the expectations of 63.4. At 19:00 GMT. the ISM Manufacturing PMI for July came in; showing a drop to 59.5. against the projected 60.8, which weighed on the US dollar and pushed gold higher.
The Construction Spending for June also declined, coming in at 0.1%, against the predicted 0.4%, which also put negative pressure on the greenback. The ISM Manufacturing Prices reduced to 85.7, against the forecast of 87.9, weighing on the US dollar, and keeping the yellow metal higher on the board.
US manufacturing activity in July grew at a slower pace for the second month in a row. The slow momentum could be attributed to the disturbed raw-material deliveries, amid shortages in the supply chain. However, there were also some signs of recovery in supply-chain bottlenecks.
The soft US manufacturing data weakened the American currency and pushed the GOLD prices higher on Monday.

Gold Supported Amid Increased Numbers of COVID-19 Cases
The rising number of coronavirus cases, due to the spread of the highly contagious Delta variant; also kept the gold prices supported. The US states of Florida and Louisiana have come close to reaching their highest hospitalization rates during the entire pandemic. as the Delta variant is spreading continuously across these regions. Related concerns added further strength to the yellow metal prices.
A senior Central Bank Governor; Christopher Waller. said that the Federal Reserve could begin slowing down its bond purchases as early as October. He added that if there was an improvement in employment, with figures falling in a range between 800,000 and 1 million. the Fed might start tapering its asset purchases in October.
He said that a drop in jobless data in August and September; within the range mentioned above, would mean that the US economy was close to the pre-pandemic level. These comments by a governor of the central bank of the United States added strength to the US dollar during the late trading hours, and the greenback recovered some of its early losses.
During the late American hours, the come-back of the US dollar pulled the gold prices down. and the precious metal lost all of its daily gains; so that the GOLD prices ended the day with a flat movement.
Gold – XAU/USD – Daily Technical Levels
Support Resistance
1,808.51 1,823.41
1,800.98 1,830.78
1,793.61 1,838.31
Pivot Point: 1,815.88
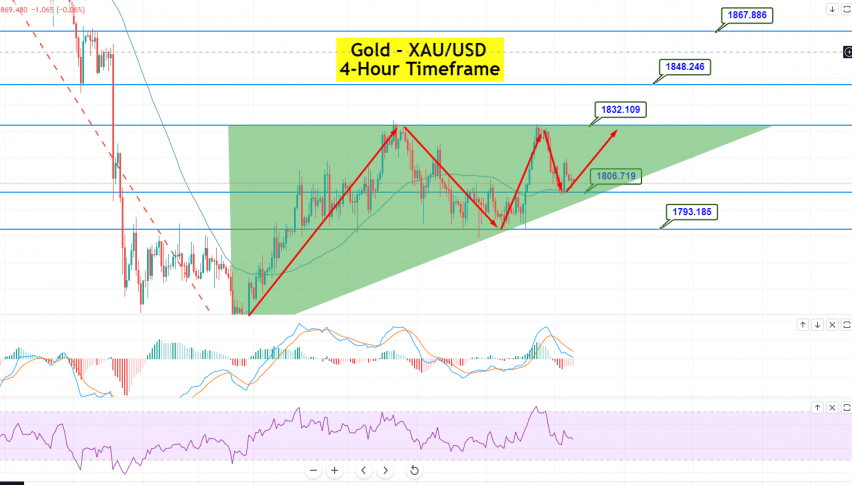
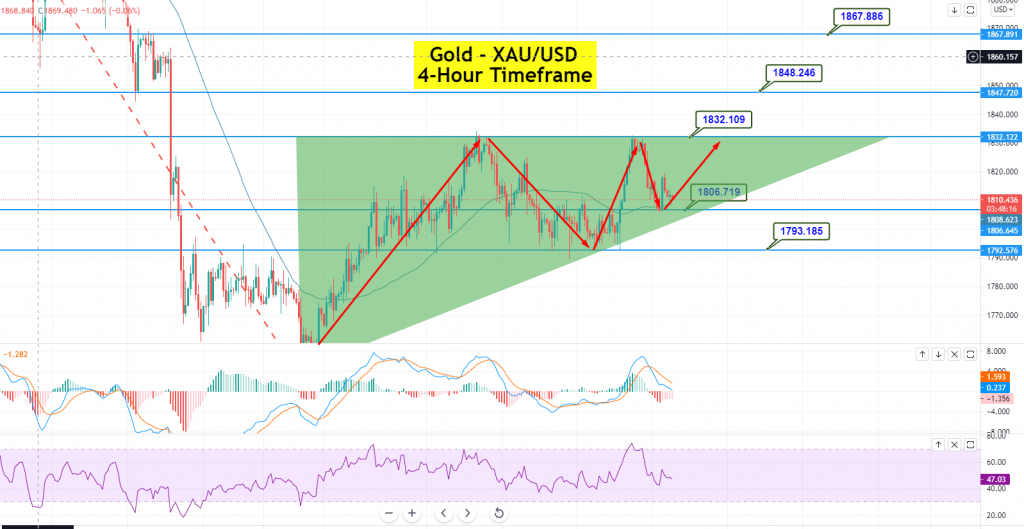
Gold – XAU/USD – Technical Outlook – Ascending Triangle Support at $1,806
GOLD is trading at 1,808, and gaining support over the 50 periods EMA level of 1,806. A bearish breakout at this level could extend the selling trend until the next support level of 1,793. At the same time, the resistance remains at 1,819. The downward trendline extends resistance at the 1,819/20 level; however, a breakout at this level could drive more buying until 1,833. The MACD and the RSI are in a selling zone; supporting odds of a continuation of the selling trend. On Tuesday, we should keep an eye on the 1,806 level; as above this, the bullish bias will continue to be solid. Good luck!


What’s Happening i am new to this, I stumbled upon this I have found It absolutely helpful and it has helped me out loads. I hope to contribute & assist other users like its helped me. Great job.