XAU/USD Price Forecast: Tipping Point for Gold as FOMC Looms? Recession Talk and USD in Focus

GOLD OUTLOOK
- Spotlight on Fed rate decision.
- Recession fears could help prop up gold.
- Chart pattern breakouts being tested.
XAU/USD FUNDAMENTAL BACKDROP
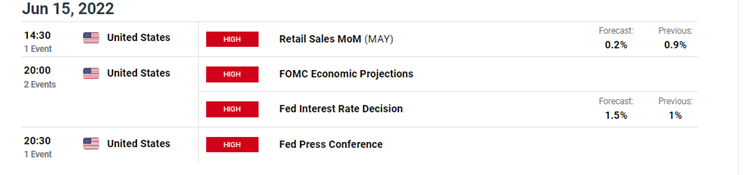
Tipping Point for Gold: Gold found some bids this morning after the week’s significant drop towards $1800/oz. The U.S. dollar being one such influence is trading marginally lower thus boosting gold prices ahead of the Fed’s interest rate decision later this evening (see calendar below). Retail sales will serve as a precursor to the Fed rate decision and we could see anything higher than 0.2% could add to the already hawkish narrative, leading to a stronger dollar and weaker gold.
ECONOMIC CALENDAR
Tipping Point for Gold
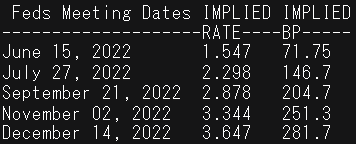
Money markets are currently pricing in 71bps which is a far cry from the Fed’s prior forward guidance of 50bps jumps (see table below). The revision higher sourced from last week’s U.S. inflation beat and should the Fed go against its own guidance, distrust for the central bank may begin to fester which could increase uncertainty and volatility in future meetings. The post-announcement press conference will serve as a key point of interest regarding the dot plot, inflation and GDP projections. Expect significant volatility for the dollar (and thus spot gold) pre and post-announcement but overall if we see a 75bps hike then my view remains in favor of the dollar. Traditionally, this should weigh negatively on gold prices but with talk of stagflation and an impending recession, bullions safe haven allure may come to the fore and allow the yellow metal to remain somewhat buoyant in the face of a ballooning dollar.
FED INTEREST RATE PROBABILITIES
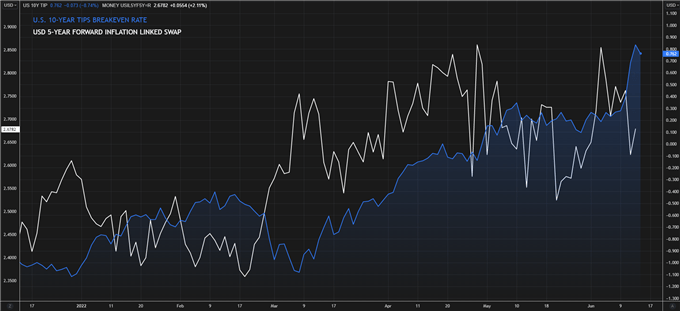
The graphic below shows the tailwind factors adding to golds upside this morning in the way of lower real yields (blue) stemming from higher inflation expectations (white). This is unlikely to remain at current levels after the fed rate decision but it’s a good marker pre-Fed.
U.S. 10-YEAR TIPS BREAKEVEN RATE vs USD 5-YEAR FORWARD INFLATION LINKED SWAP
TECHNICAL ANALYSIS
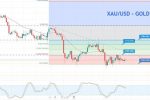
GOLD PRICE DAILY CHART
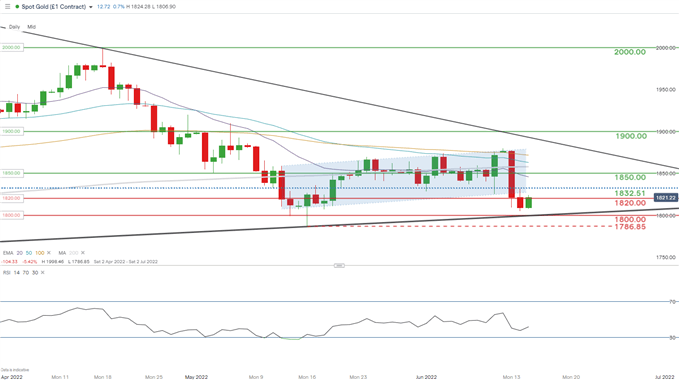
Chart prepared by Warren Venketas, IG
The daily spot gold chart shows prices hovering around the key inflection point at $1800.00 which coincides with the longer term symmetrical triangle (black) formation. Currently, the breakout from the bear flag (blue) points to further downside towards subsequent support zones.
Resistance levels:
- 1850.00
- 20-day EMA (purple)
- 1832.51 (23.6% Fibonacci)
Support levels:
- 1820.00
- 1800.00
- 1786.85
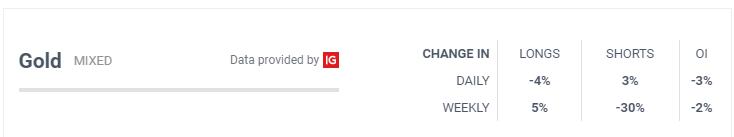
IG CLIENT SENTIMENT: MIXED
IGCS shows retail traders are currently distinctly LONG on gold, with 85% of traders currently holding long positions (as of this writing). At DailyFX we typically take a contrarian view to crowd sentiment however, due to recent changes in long and short positioning we arrive at a short-term cautious bias.