Oil Q1 2022 Technical Forecast: Bullish Fatigue and Potential Bearish Reversal

A CASE FOR THE BEARS: BULLISH EXHAUSTION AND POTENTIAL LONG TERM REVERSAL
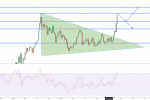
Oil Q1 2022 Technical: In the absence of a sizeable bullish catalyst, it would seem that the current long-term trendline will soon come under threat. This wouldn’t necessarily be as a result of a strong bearish bias; but rather because of a slowing rate of price appreciation previously experienced as the global economy came out of lockdown and international travel resumed.
At this rate, a break below the long-term trendline may simply be attributed to the passing of time as price action consolidates and would not necessarily amount to a sudden bearish bias. That being said, a prolonged period of consolidation can be symptomatic of a fatigued market which may be due for retracement. Potentially even a bearish reversal, subject to confirmation.
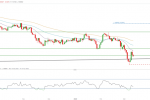
Signs of a bullish continuation appear to be losing momentum as we witnessed a rather aggressive drop after the failed attempt to reach the 86.67/87 level – a point of historical importance as it often served as support/resistance where breaks above or below often resulted in an extended move. For reference, see the monthly chart below highlighting major inflection points in blue:
CHART 1: BRENT CRUDE OIL (MONTHLY) HIGHLIGHTING MAJOR SUPPORT/RESISTANCE LEVEL
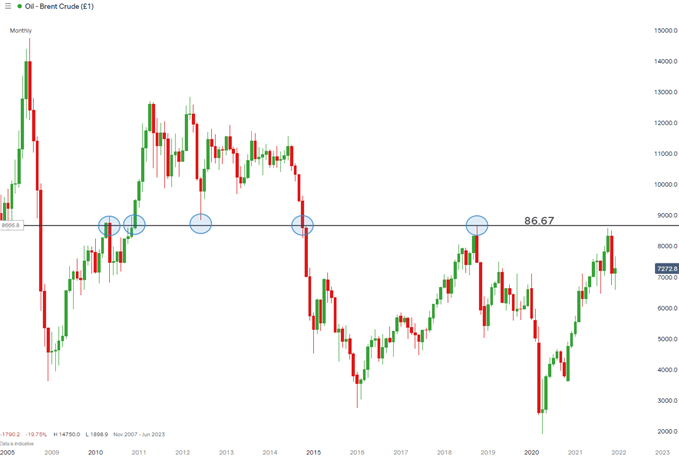
Chart prepared by Richard Snow, IG
Retracements during the early stages of the existing bull run were rather small before frantically continuing higher. This is often seen in strong trending markets; whereas more recently, retracements have become sharper and more pronounced – signaling possible fatigue.
POTENTIAL ‘HEAD AND SHOULDERS’ PATTERN THREATENS CURRENT BULL RUN
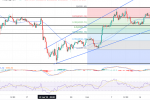
The weekly chart helps to visualize a developing (but not confirmed) long-term reversal pattern known as a ‘head and shoulders formation. Should prices move sideways we may see somewhat of a complex right shoulder as price action oscillates up and down. A move below the trendline followed by a retest may set the scene for a move towards $70. The slanted neckline with a price of around $66, presents a crucial decision point as a breakdown of this level with continued momentum strengthens a long-term bearish reversal trading bias.
CHART 2: CRUDE OIL (WEEKLY) HIGHLIGHTING POSSIBLE H&S FORMATION
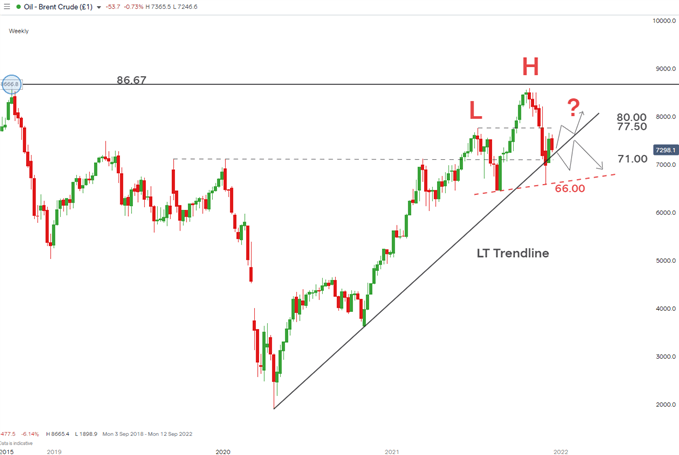
Chart prepared by Richard Snow, IG
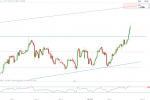
A Case for the Bulls: Partial Recovery from Initial Omicron Scare Brent crude oil prices failed to retest the 86.67/87 area as bearish momentum gained strength on the back of the Biden’s coordinated SPR release followed by the outbreak of Omicron. Since then, there has been a considerable recovery as prices initially broke below the long-term trendline support but almost immediately recovered.
Current levels (as of 15 December 2021) have only partially recovered from recent losses. Crude trades just above the long-term trendline so if there is to be some sort of bullish revival it needs to happen soon. The first real test remains 77.50, then 80 before any retest of the October high can be entertained. All of these levels seem rather distant but should not be disregarded.