Gold Breaks Below Symmetrical Triangle $1,857 – What’s Next?

GGold Breaks Below, Gold prices closed at $1851.60 after setting a high of $1868.10 and a low of $1844.20. The XAU/USD prices plunged for the second consecutive session on Friday and extended their losses amid the growing strength of the greenback. The US Dollar Index soared to 96.24, its highest level since July 2020; rising DXY prices had a negative influence on the precious gold prices, dragging them lower on Friday. Whereas US Treasury Yields on the benchmark 10-year note fell on Friday, extending their loss for the third straight session to as low as 1.51%.
Gold Rate Live
On Tuesday, Federal Reserve Governor Christopher Waller said that the bank should accelerate the pace of its decrease in bond purchases to give more flexibility to boost interest rates from their near-zero level sooner than it currently expects if high inflation and the strength of job gains persist. He said that he favored a faster pace of tapering and a more rapid removal of accommodation in 2022 due to the improvement in the labor market and deteriorating inflation data.
Gold Breaks Below, Federal Reserve Vice Chair Richard Clarida Remarks
Furthermore, the Federal Reserve Vice Chair, Richard Clarida, also said that central; banks in different countries could share analyses and adopt similar policies in response to common global; shocks. He noted that central banks were not immune to each other’s policies and that not only do US policy changes affect foreign economies, but equally, monetary policy shifts in other countries can also affect the US economy and even force a response from the Fed.
Federal Reserve Bank President Mary Daly Remarks
Gold Breaks, Meanwhile, San Francisco Federal Reserve Bank President Mary Daly said that the Fed had begun taper its asset purchases. She reckoned that the next step for the Fed to focus on was its communications about the future path of rate hikes. Similarly, Chicago Federal Reserve President Charles Evans also said that it might take until the middle of next year to complete the Fed’s winding down of its bond-buying program even as the Federal Reserve checks to see if high inflation fades away as anticipated. All these comments from the officials of the Federal Reserve added strength to the US dollar, which ultimately dragged the prices of precious metals on Friday.
Furthermore, the number of daily reported coronavirus; cases has risen sharply, raising concerns about the resurgence of infections and supporting the risk-off market sentiment, which has limited further gold; price increases. The number of new daily coronavirus cases grew sharply this week by 9% to 517,600.

Gold Breaks Below – A Technical Outlook – Symmetrical Triangle Breakout
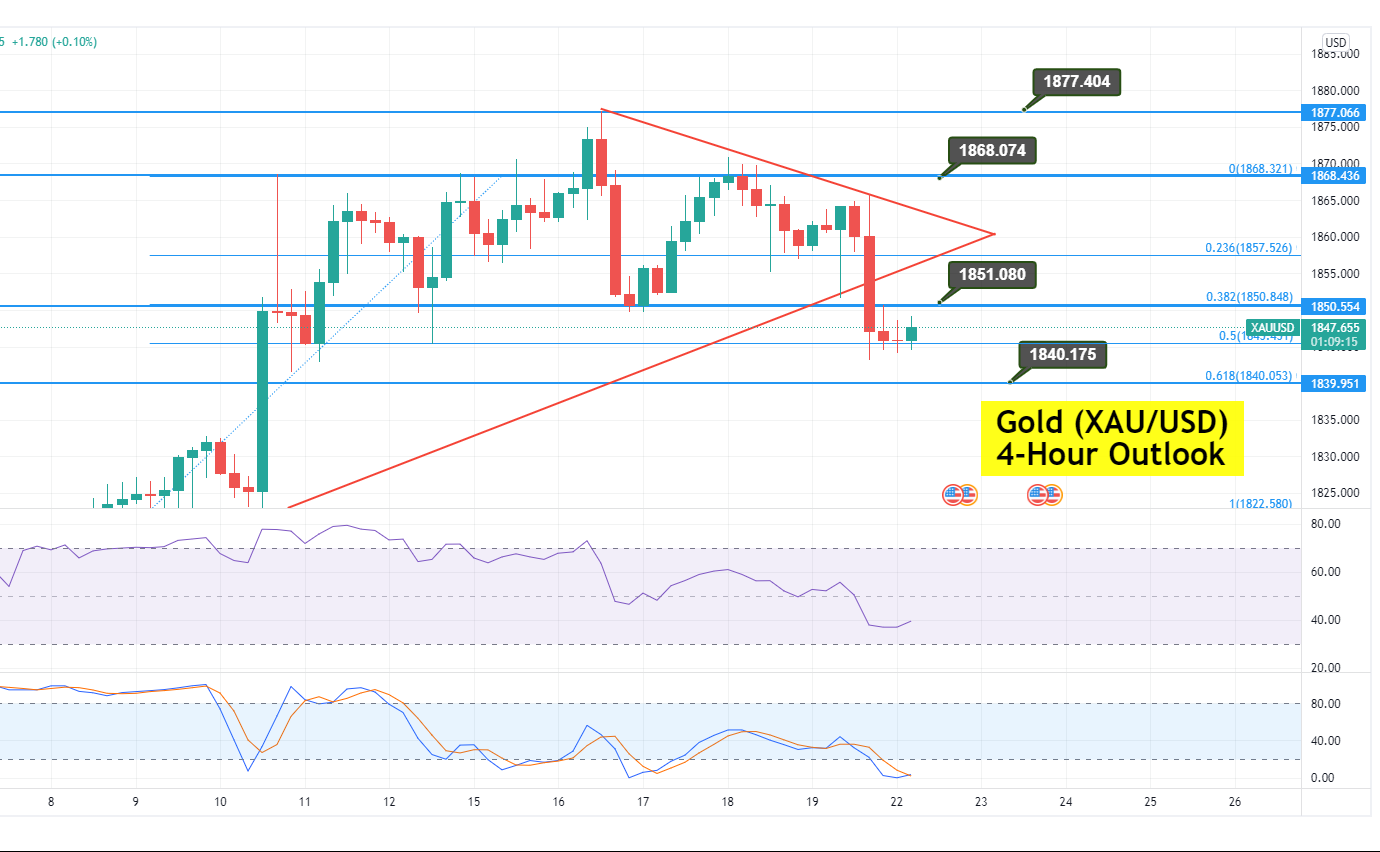
Gold Breaks, Gold is trading at the 1,847 level, facing strong resistance at the 1,857 level. On the 4-hour timeframe; XAU/USD is trading with a bullish bias; having violated the symmetrical triangle pattern at 1,857 level. The closing of candles outside this range is suggesting a selling trend in gold.
On the 4-hour timeframe, gold has completed 50% Fibonacci; retracement at 1,847, and breaking below this level has the potential to lead its prices towards 61.8% Fibo level of 1,840 level. A further breakout at 1,840 could lead the gold prices towards levels of 1,836 and 1,832.
Daily Technical Levels
Support Resistance
1841.25 1849.80
1836.30 1853.40
1832.70 1858.35
Pivot Point: 1844.85
The resistance level remains at the 1,850 level, and violation of this level; would expose the metal to the; 1,857 level. The RSI and stochastic are in the sell zone, and the closing; of candles below the 1,850 level would open the metal up to the 1,844 level. Let’s consider taking a sell trade below 1,850, and buying above the same. Good luck!


