Canadian Dollar Technical Analysis: USD/CAD, AUD/CAD, EUR/CAD – Charts to Watch

CANADIAN DOLLAR TECHNICAL FORECAST: USD/CAD, AUD/CAD, EUR/CAD
- USD/CAD approaches triangle resistance after gloomy week for the Loonie
- AUD/CAD is showing positive divergence with its RSI oscillator, a bullish sign
- EUR/CAD faces a tough path higher after fifth consecutive weekly drop
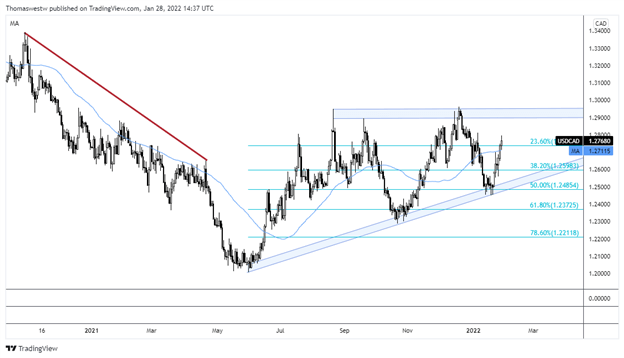
USD/CAD TECHNICAL FORECAST: BULLISH
Canadian Dollar Analysis:: The Canadian Dollar lost ground versus the US Dollar last week, with USD/CAD rising more than 1.5%, accelerating upside from the prior week. That boost stemmed from a rising trendline that serves as an Ascending Triangle’s support level. The pattern is inherently bullish, with this one, in particular, serving as a possible reversal pattern from the preceding downward trend.
Prices grappled with the 23.6% Fibonacci retracement level on Friday following a break above the 50-day Simple Moving Average (SMA). The next level to test, should prices rise this week, will be the triangle’s horizontal level of resistance. If prices were to slice above the triangle, it could open the door to further strength.
USD/CAD DAILY CHART
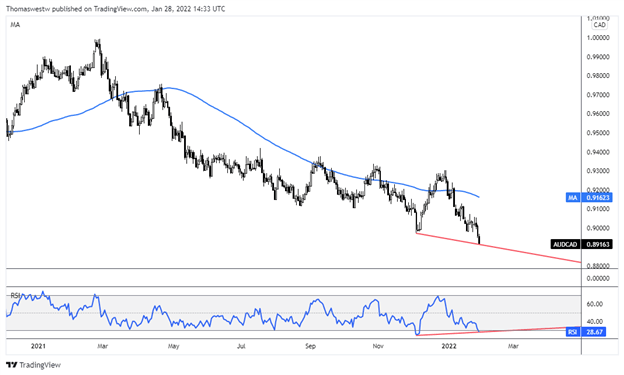
AUD/CAD TECHNICAL FORECAST: BULLISH
AUD/CAD dropped over a full percentage point last week, aided by the Australian Dollar’s reactive risk-off weakness. The currency pair fell to a new multi-year low, its lowest point since April 24, 2020. Despite the fresh lows, there are signs that a reversal could be near. Last week’s new low corresponded with a higher low in the Relative Strength Index (RSI).
Canadian Dollar Analysis: That divergence between price and the RSI oscillator is a bullish signal. That said, if a reversal does occur, the falling 50- and 200-day SMAs would serve as potential resistance. Piercing above those levels would put the lower highs seen in the preceding downtrend into focus. Alternatively, a move lower has the potential to invalidate the positive divergence seen and push the RSI reading back into oversold territory.
AUD/CAD DAILY CHART
EUR/CAD TECHNICAL FORECAST: NEUTRAL
EUR/CAD dropped for a fifth consecutive week, reversing early-week strength after failing to eclipse the falling 50-day Simple Moving Average (SMA) on an intraday move. The 38.2% Fibonacci retracement also appeared to provide some resistance. A move higher would likely see these levels pose resistance again.
If prices pierce above those levels, it would open the door for a test of the 100-day SMA, which capped upside back in December. The 26-day Exponential Moving Average (EMA) also appears to be a sticking point for bulls since 2022 kicked off. A move lower would quickly bring the January low at 1.4100 back into play. A break of that level would likely introduce further weakness.
EUR/CAD DAILY CHART