S&P 500 Volatility Should Settle if Risk Appetite is Set, AUDCAD a Top Watch
- S&P 500 Volatility; Risk appetite soared this past session with a speculative bid spreading much further than the S&P 500’s 0.9 percent gap and 2.1 percent rally
- With the surge in the SPX, the implied volatility measure of the VIX would naturally deflate; but stability for bulls is best served if actual price volatility settles
- Aside from the eddies of risk trends this late in the year, we have unclear risks like China’s financial health and tangible such as the upcoming BOC rate decision
S&P 500 Volatility; RISK APPETITE SWELLS WITH BOTH INTENSITY AND BREADTH
Though I’m generally skeptical around the ‘value’ of the heady levels of capital market benchmarks, there is little point in disputing the intent of speculators. This past session was marked by an unmistakable risk appetite that lifted most asset types that find themselves meaningfully situated on one side of the ‘high return to safe haven’. What’s more, the charge was notably intense. Emerging markets assessed by the EEM ETF rallied 1.6 percent, the HYG junk bond ETF extended its strongest four-day rally in 13 months, AUDJPY posted its biggest two-day charge since June of last year and crude oil has now swung 15 percent off of lows from last Thursday. As impressive as all of these moves are – individually and collectively – it is the charge from equities that was most remarkable. ‘Rest of world’ equities earned the biggest single-day advance in 9 months, while the S&P 500 again carried the glory for the US indices. The 0.9 percent gap higher to open this past session was the biggest bullish jump since November last year while the overall 2.1 percent overall daily performance tops performance back to the first day of March. At this pace, a record high is not even a day away. That said, keeping this pace would exacerbate the risk of reversals.
Chart S&P 500 with 100 and 200-Day SMAs with Daily Gaps (Daily)
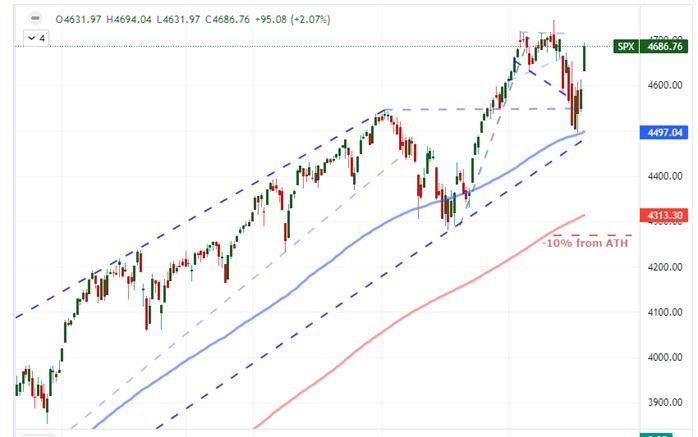
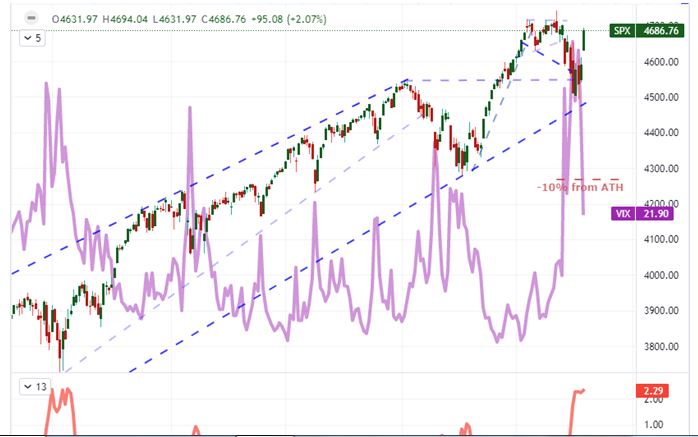
In general, volatility has a strong negative relationship with a favorable trend in buy-and-hold markets. We can see this very explicitly in the correlation between the S&P 500 and the VIX volatility index. Naturally, the volatility measure is derived from options on the underlying US index, and these products were once used disproportionately to hedge. Appetite for the protection rose when markets retreated and flagged as it swelled – somewhat of a lagging feature. That said, outright speculation has changed the nature of this derivative and makes the implied element of its calculation less indicative. I am more partial to ‘realized’ volatility which is the actual level of price action in the market. On that front, the intensity of Tuesday’s rally is a concern. It extends the amplitude of a five-day extreme activity measure that keeps us exposed to the possibility of reversals.
Chart of S&P 500 with 20-Day ATR Overlaid with VIX (Daily)
THE ABSTRACT FUNDAMENTAL THREATS AND THE SCHEDULED EVENT RISK
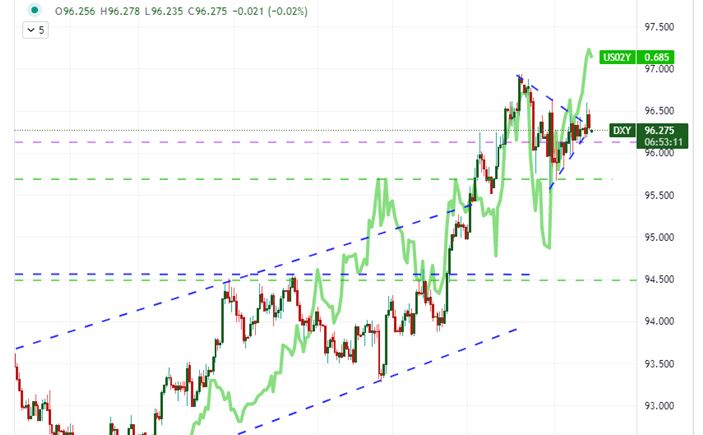
With such a groundswell of speculative interest, it would seem that we are in a situation where new developments, in general, are more likely a threat to follow through. There aren’t many outright matters that can add a substantially positive upgrade to the underlying value of the markets. There has been some sense of relief around the severity of effects from the new omicron variant of the coronavirus – though it was reported that the Pfizer vaccine may be significantly less effective at suppressing the infection’s side effects. Similarly, the expectations of a technical extension of the US government’s funding to avert a December 15th financial crisis is only a relief rally. Meanwhile, we have express risks of a technical default of Evergrande and Kaisa, property developers in China, as the grace period on their debt repayments passes. Furthermore, the favorable sway in risk markets helps bolster the rate expectations, which were considered a threat to market progress just weeks ago. Below, you can see the US 2-year Treasury yield has extended its charge and bolstered expectations for early hikes and a faster taper.
Chart of DXY Dollar Index Overlaid with US 2-Year Treasury Yield (8-Hour)
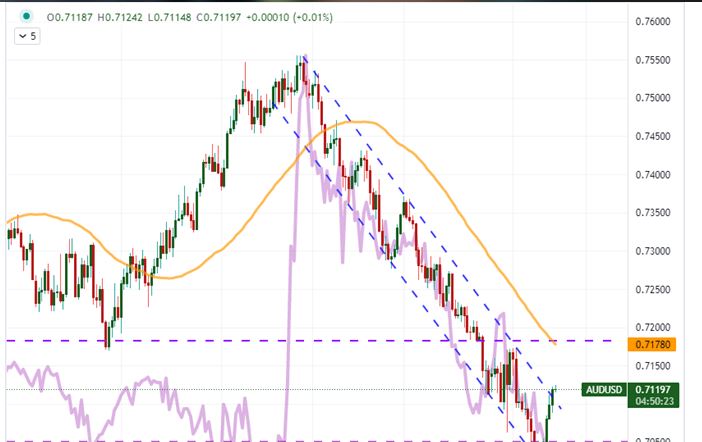
On the scheduled side of the fundamental picture, there are a host of data points that run along the lines of sentiment surveys, manufacturing reports, and trade. Little of it has established serious market traction over the past 24 hours, so I am not setting my expectations for a more productive response in the coming 24 hours. On the other hand, monetary policy has generated traction and is likely to be a depth charge for targeted volatility ahead. From the Reserve Bank of Australia, the central bank made an explicit effort to foster that perception that it was not eager to tighten; but it did maintain a favorable economic forecast through omicron concerns. That persistence alone helped lift the Aussie Dollar which had been under serious pressure these past weeks. In few places is this more technically apparent than AUDUSD as it pushed through the top of its descending trend channel.
Chart of AUDUSD with 50-Period Moving Average Overlaid with AU-US 2-Year Yield Spread (8-Hour)
S&P 500 Volatility; TOP EVENT RISK AND MY PREFERRED FX VEHICLE
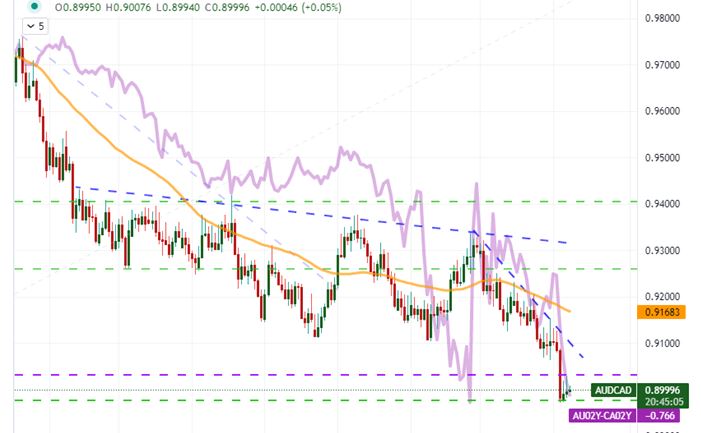
AUDUSD is a technically interesting cross, but the Greenback can readily act like an anchor among its pairings as traders await Friday’s CPI release in advance of next Wednesday’s FOMC decision. Monetary policy speculation without the Dollar has some interesting considerations. There are two emerging market rate decisions over the coming session: the Reserve Bank of India is expected to hold while it is stationed just at a major range resistance while the Brazil central bank is expected to hike by 150 basis points but its chart isn’t nearly as pressing. The most interesting monetary policy event on my radar though is the Bank of Canada update at 15:00 GMT. Just as the Aussie Dollar found lift by a mundane view because of the discount going in, the Canadian Dollar has experienced speculative stretch heading into the BOC decision with nearly 100 basis points worth of tightening priced in over the next 12 months. That is beyond aggressive, even if the first hike is expected at this meeting. If the BOC offers anything close to a dovish reticence, a pair like AUDCAD would be in a fundamentally leveraged position to respond.
Chart of AUDCAD with 50-Period Moving Average Overlaid with AU-CA 2-Year Yield Spread (8-Hour)