S&P 500 and Nasdaq 100 Can’t Shake Off the Blues as Yields Rise, Netflix Earnings Eyed

US STOCKS OUTLOOK:
- U.S. stocks turn in mixed performance at the start of the week as rising Treasury yields reduce appetite for risk assets
- S&P 500 and Dow Jones finish the day modestly lower; Nasdaq 100 ekes out small gain
- This article looks at the key technical levels for the S&P 500 and Nasdaq 100 to watch out for in the coming days.
Most read: Oil Rises as Libya Halts Production at Largest Field & EU Mulls Russian Crude Ban
S&P 500 and Nasdaq 100: After swinging between positive and negative territory throughout the day, U.S. stocks finished the day largely flat, held back by rising rates across most of the U.S. Treasury curve on expectations that sky-high inflation will lead the Federal Reserve to aggressively remove policy accommodation over the coming months to restore price stability.
When it was all said and done, the S&P 500 inched down 0.02% to 4,374, extending its decline for the second consecutive session and closing at its lowest level in a month, with most sectors relatively soft, except for energy, which managed a solid rise. The Dow Jones, for its part, fell 0.11% to 34,411, but weakness was limited by a 2.56% rally in Goldman Sachs stock prices.
S&P 500 and Nasdaq 100
Elsewhere, the Nasdaq 100, eked out a 0.13% advance thanks to a late day-push, finishing at 13,910, but gains were contained by soaring yields, with the 10-year shooting up to 2.86%, its highest level since December 2018. Rising yields weigh on companies’ valuations by increasing the rate at which future cash flows are discounted, but the pressure tends to be more acute for tech and growth shares whose valuations are based on earnings expected to materialize further down the road.
Looking ahead, there are no high impact economic data on Tuesday, so investors will remain laser-focused on the earnings season that has just gotten underway last week. That said, Johnson and Johnson (JNJ) and Netflix (NFLX) are two key companies, with huge market capitalizations, whose results are worth watching tomorrow (see table below for consensus expectations).
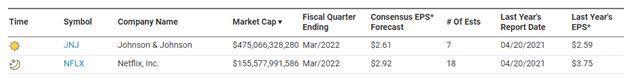
Source: Nasdaq
It is still too early to make broad assumptions, but the reporting period is off to a decent start with 81.5% of S&P 500 companies that have announced results posting better-than-forecast EPS figures according to FactSet. If this trend consolidates and firms continue to deliver good numbers, excessive market pessimism should start waning, encouraging investors to redeploy capital into risk assets.
While earnings are always key, forward-guidance is likely to be more important for Wall Street in the coming days and weeks. In this context, traders should pay close attention to any comments about the outlook, profits and how management is handling ongoing supply chain snags and surging costs. Ultimately, if margins remain healthy and prospects stay constructive, sentiment could improve, paving the way for a meaningful rebound in stocks.
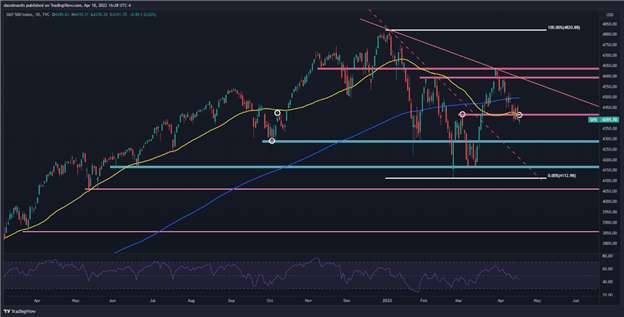
S&P 500 TECHNICAL ANALYSIS
Although the outlook improved slightly for the S&P 500 in March, the technical picture has worsened again following recent weakness. As seen on the daily chart, the index has lost its 50-day moving average and has fallen below a key floor around the psychological 4,400 mark, both bearish signals for price action. With sellers in control and no significant support zones around current levels, the probability of a retest of the October 2021 low near 4,280 has increased.
Alternatively, if buyers return and the index drifts higher, we’d need to see a decisive move and a weekly close above the 50-day moving average to become convinced further gains are possible. If this scenario plays out, initial resistance lies at 4,495 (200-day SMA), followed by 4,590, an area of interest created by a descending trendline extended off the record high.
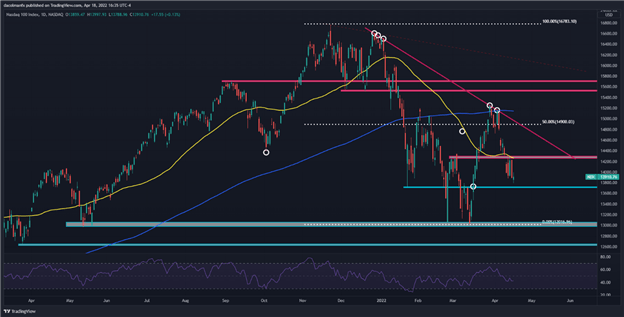
NASDAQ 100 TECHNICAL ANALYSIS
The Nasdaq 100 also rebound aggressively in March, but the tech benchmark’s advance was stopped dead in tracks by descending trendline extended off the December 2021 lows. After being repelled by this technical resistance, the index dropped precipitously, hitting briefly a nearly five-week low on Monday. If selling pressure intensifies in the coming days, initial support rests at 13,715, the January low, but a move below this floor could expose the 2022 lows.
On the flip side, if dip buyers resurface and the index charges higher, resistance appears at 14,265. If bulls manage to clear this barrier, bullish momentum could pick up, setting the stage a possible move towards trendline resistance at 14,900.