Bitcoin (BTC/USD) Breaks Resistance, Altcoins Short-term Rally Continues

Bitcoin (BTC/USD) Breaks, The late-Thursday sharp rally in Bitcoin has continued today, setting up the market leader for a fresh attempt at a resistance zone around $2k higher up. The small risk-on move yesterday, initially prompted by news of peace talks between Russia and Ukraine, has also found support from talk that the decentralized currency is being bought by parties in both countries. In the linked story, DFX analyst Thomas Westwater notes that on-chain data show a ‘significant uptick in trading volumes in Russia’s Ruble and Ukraine’s Hryvnia’ in recent days.
While this volume in Russia, in particular, may bring additional regulatory scrutiny, the move higher in Bitcoin has seen tough resistance at $39.6k taken out with ease, and now sets up BTC for a run at the next zone of resistance between $45.5k and $45.8k. Above here, a cluster of prior highs around $48k comes into play.
BITCOIN (BTC) DAILY PRICE CHART – MARCH 1, 2022
Chart via TradingView
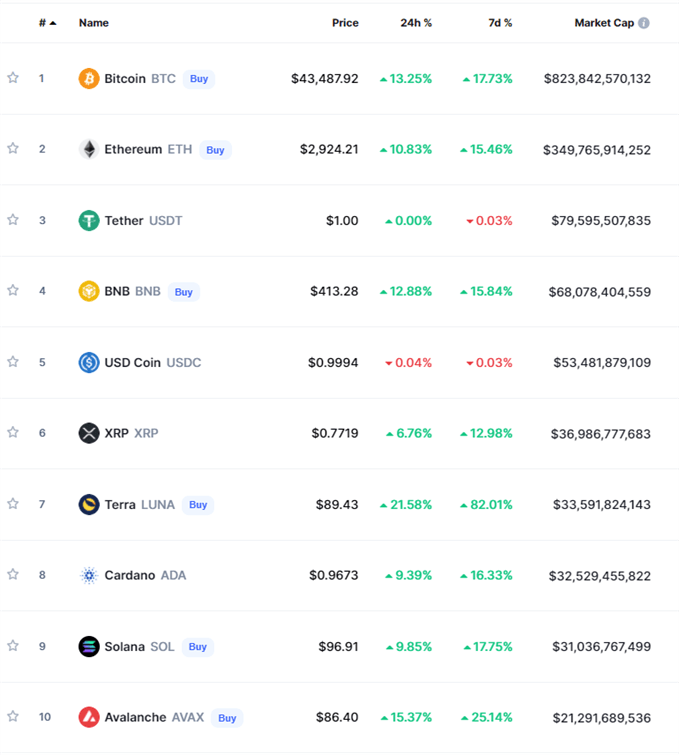
A look at the top 10 cryptocurrencies by market capitalization; using data from CoinMarketCap, shows the recent 1-day and 7-day performance of the current market heavyweights. While the 7-day performance of some coins looks impressive, it should be noted that these rallies are off some multi-month lows and some coins are still heavily below their peaks.

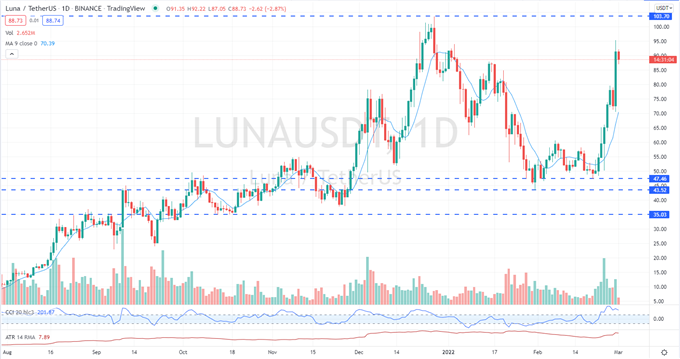
One coin that stands out immediately is Terra (LUNA) which is over 80% higher; on the week and is approaching its all-time high. While the move currently looks strong, the CCI indicator at the bottom of the chart shows LUNA as heavily overbought and this may need; to be pared back if a new ATH is to be made in the coming weeks.
TERRA (LUNA) DAILY PRICE CHART – MARCH 1, 2022

Chart via TradingView
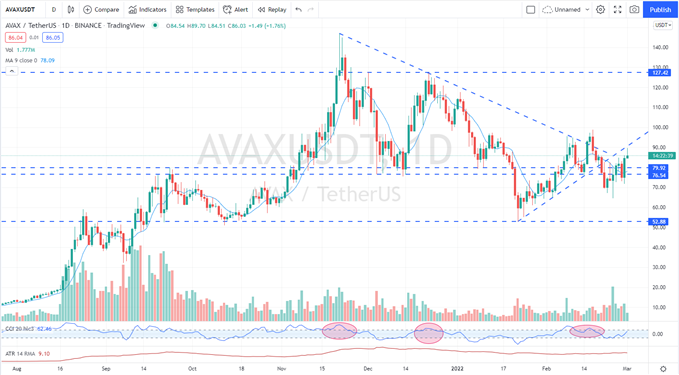
The 10th largest coin by market cap, Avalanche (AVAX); has also performed well lately after breaking below its short-term uptrend line started off the January 22 multi-month low. If this trendline can be reclaimed then AVAX may test the February 17 high at $99 soon.
AVALANCHE (AVAX) DAILY PRICE CHART – MARCH 1, 2022

Chart via TradingView
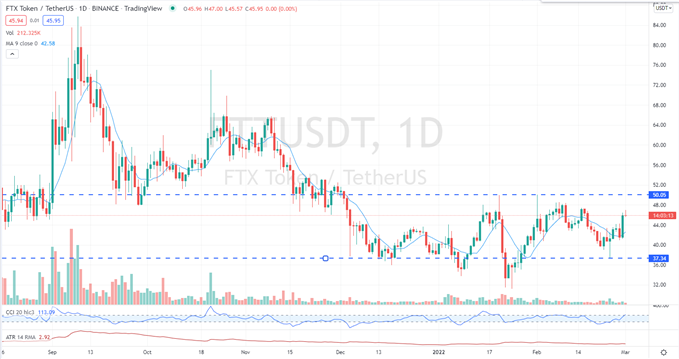
Fantom (FTM) has also put in a decent shift higher recently; and has broken a series of lower lows and lower highs. The CCI indicator is in overbought territory, prompted by the recent sharp rally, but as long as the February 24 low remains unbroken, then Fantom may re-test the January 20/February 1 double high at $50.
Bitcoin (BTC/USD) Breaks, FANTOM (FTM) DAILY PRICE CHART – MARCH 1, 2022

Chart via TradingView
What is your view on Bitcoin – bullish or bearish?? You can let us know via the form; at the end of this piece or you can contact the author via Twitter @nickcawley1.


